Fork me on GitHub

包含关键字 ound 的文章

Dapr 学习笔记

Dapr 的全称为 Distributed Application Runtime(分布式应用运行时),顾名思义,它的目的就是为分布式应用提供运行所依赖的的执行环境。Dapr 为开发者提供了服务间调用(service to service invocation)、消息队列(message queue)和事件驱动(event driven)等服务模型,它可以让开发人员更聚焦业务代码,而不用去关心分布式系统所带来的其他复杂挑战,比如:服务发现(service discovery)、状态存储(state management)、加密数据存储(secret management)、可观察性(observability)等。

下面这张图说明了 Dapr 在分布式系统中所承担的作用:
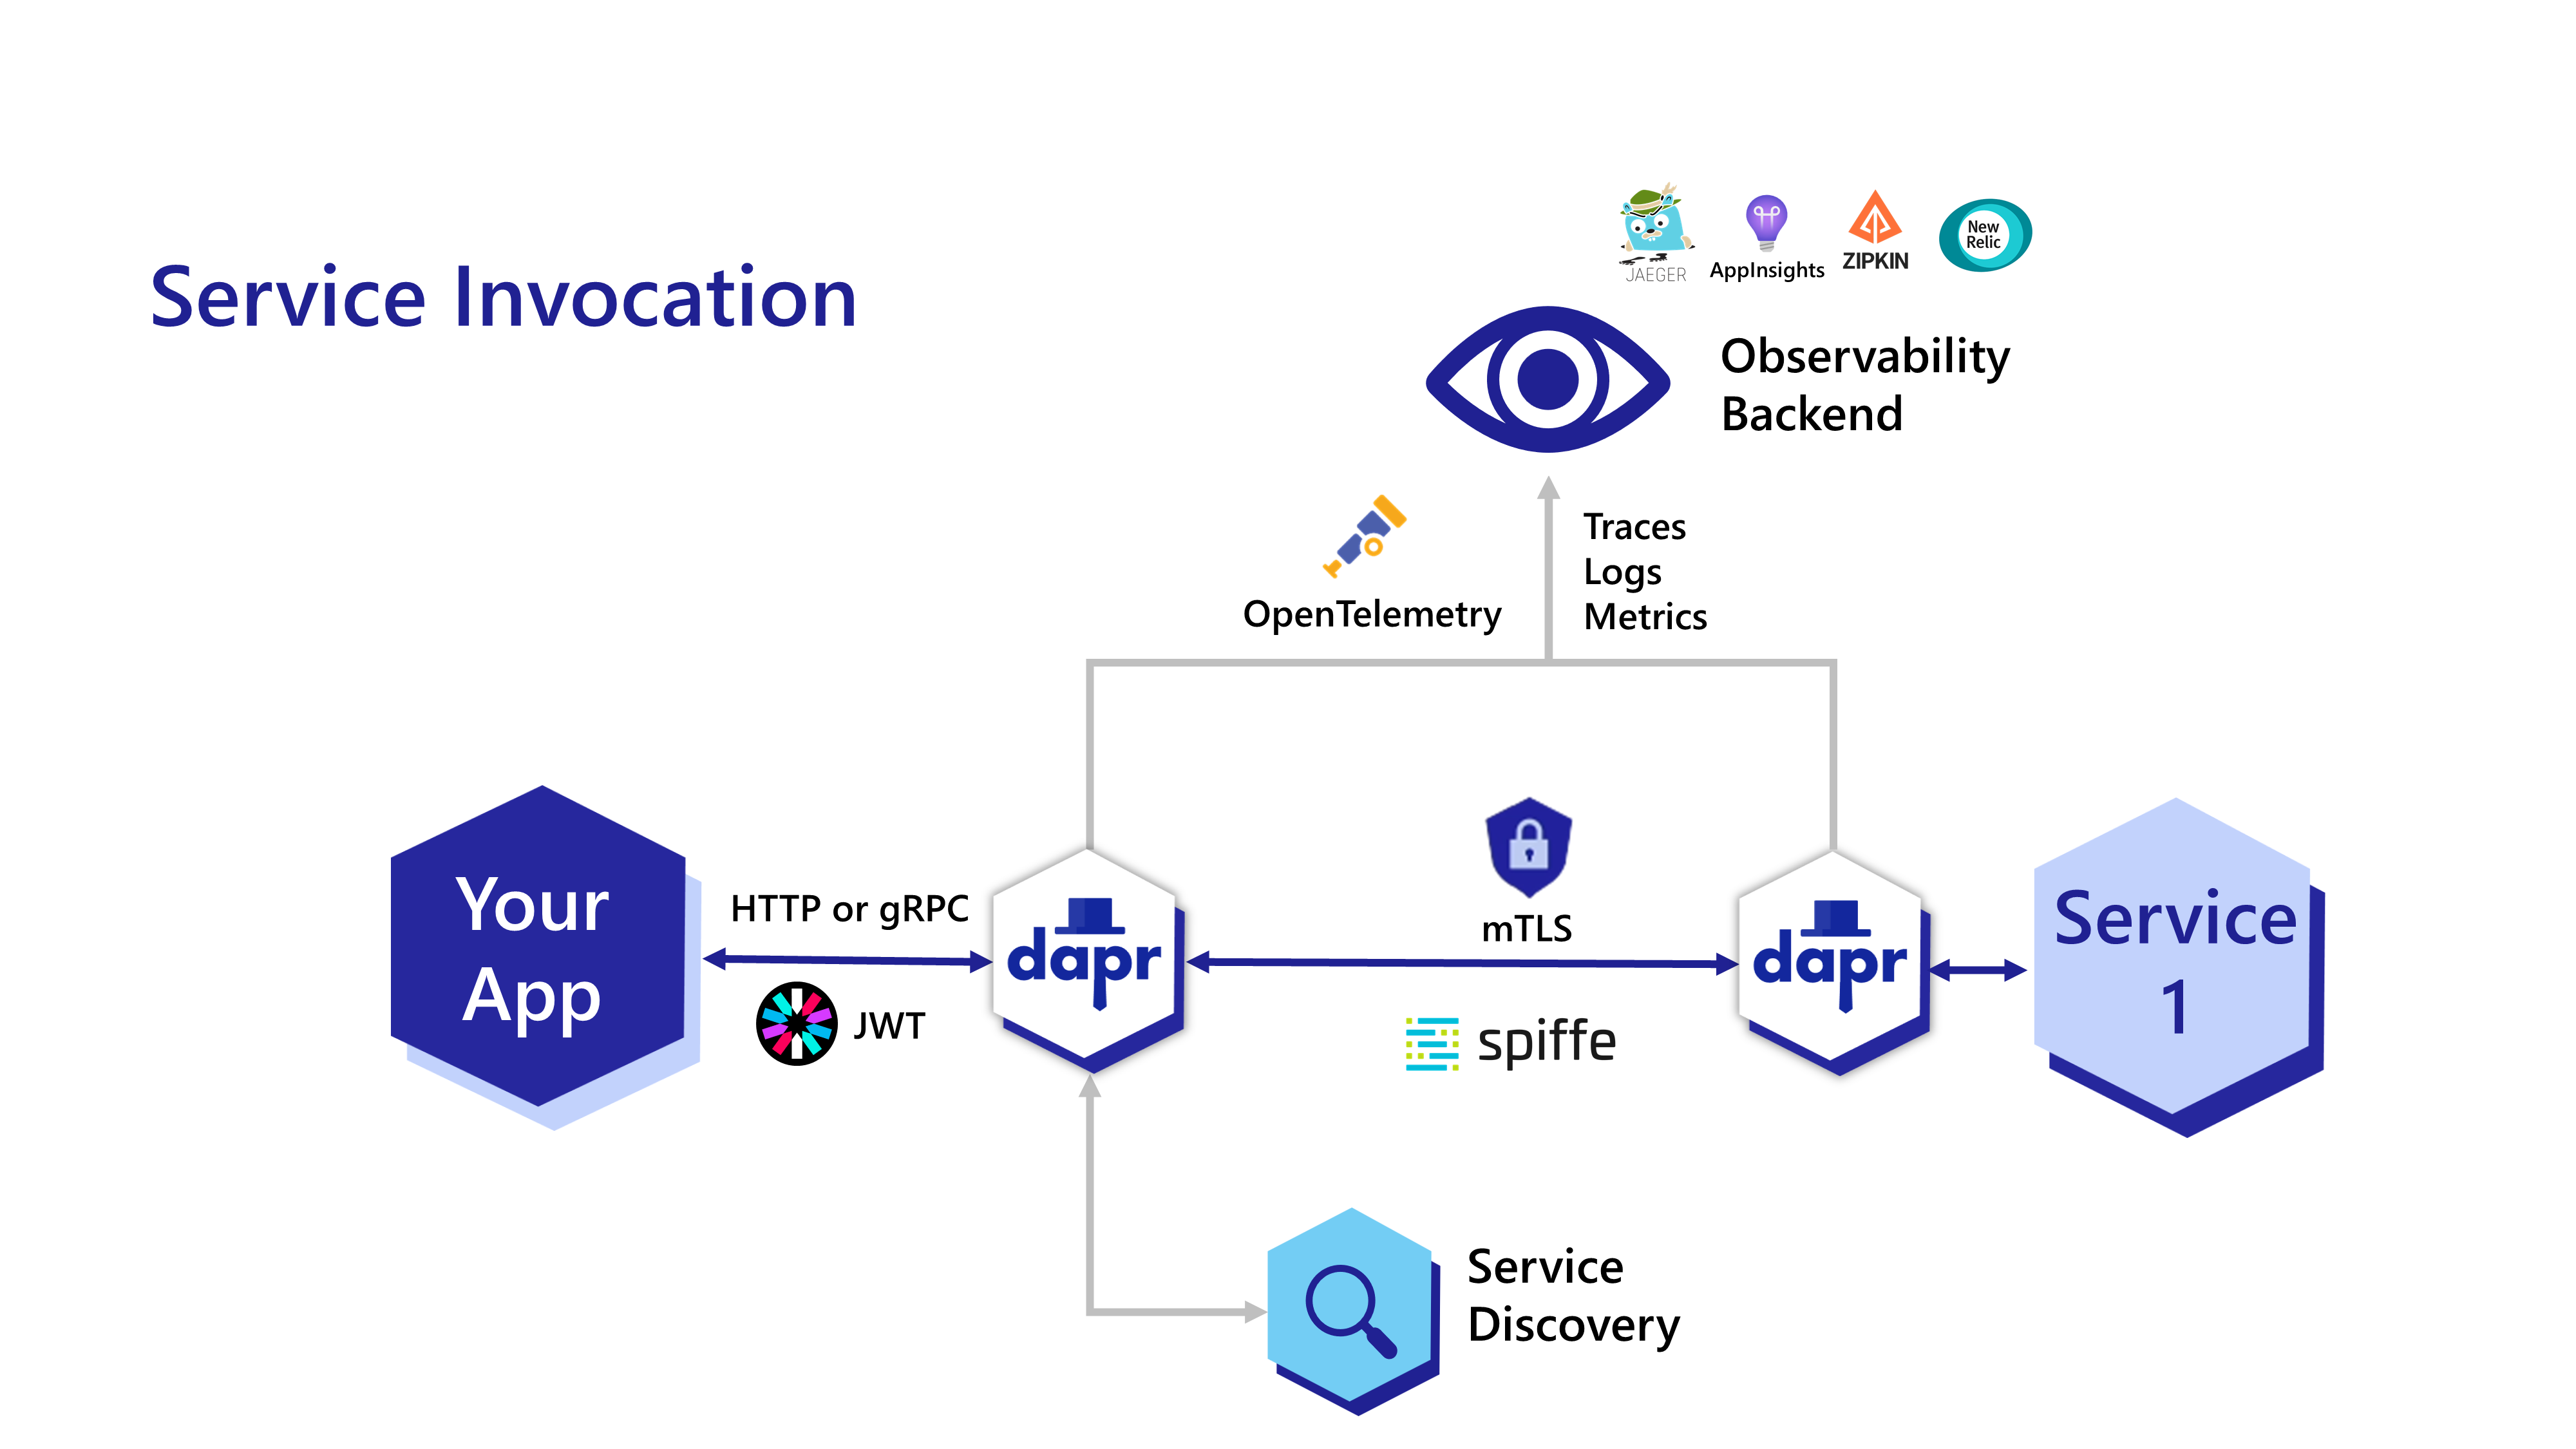
service-invocation.png

这是分布式系统中最常用的一种场景,你的应用需要去调用系统中的另一个应用提供的服务。在引入 Dapr 之后,Dapr 通过边车模式运行在你的应用之上,Dapr 会通过服务发现机制为你去调用另一个应用的服务,并使用 mTLS 提供了服务间的安全访问,而且每个 Dapr 会集成 OpenTelemetry 自动为你提供服务之间的链路追踪、日志和指标等可观察性功能。

下图是基于事件驱动模型的另一种调用场景:
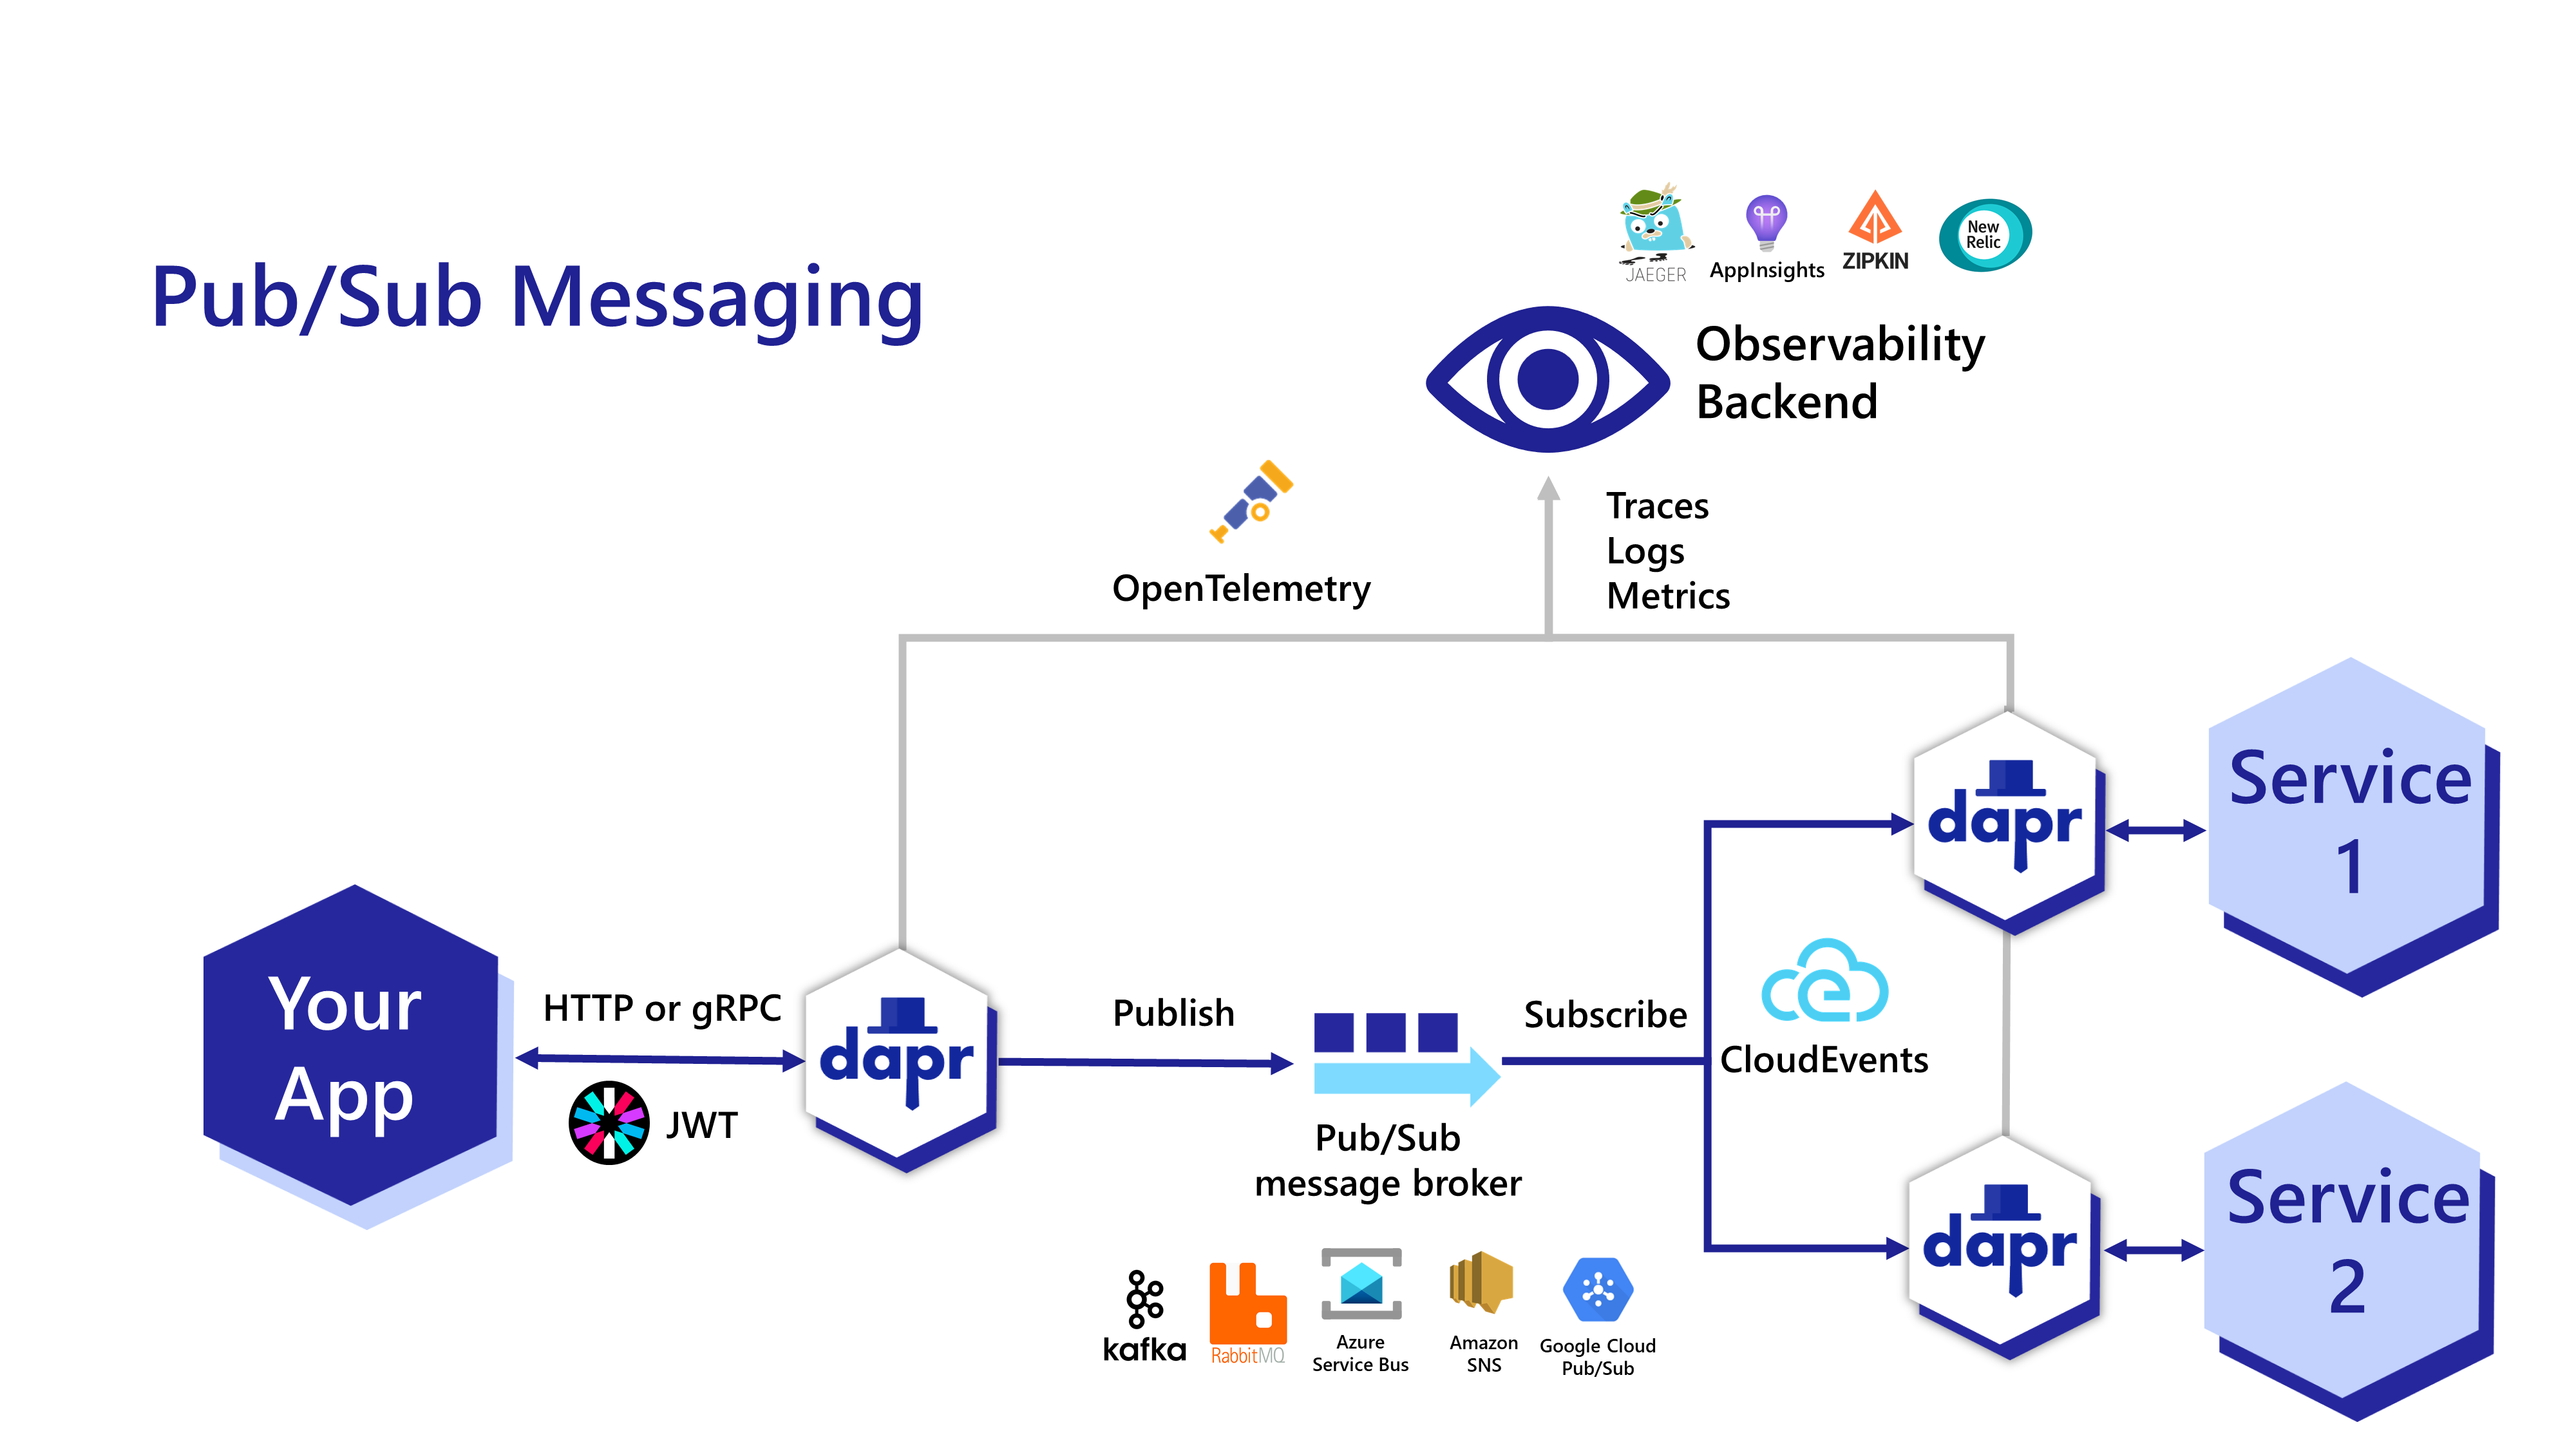
pubsub.png

安装 Dapr

1. 安装 Dapr CLI

首先使用下面的一键安装脚本安装 Dapr CLI

[root@localhost ~]# wget -q https://raw.githubusercontent.com/dapr/cli/master/install/install.sh -O - | /bin/bash
Getting the latest Dapr CLI...
Your system is linux_amd64
Installing Dapr CLI...

Installing v1.6.0 Dapr CLI...
Downloading https://github.com/dapr/cli/releases/download/v1.6.0/dapr_linux_amd64.tar.gz ...
dapr installed into /usr/local/bin successfully.
CLI version: 1.6.0 
Runtime version: n/a

To get started with Dapr, please visit https://docs.dapr.io/getting-started/

使用 dapr -v 校验是否安装成功:

[root@localhost ~]# dapr -v
CLI version: 1.6.0 
Runtime version: n/a

注意,这里我们可以看到 Runtime versionn/a,所以下一步我们还需要安装 Dapr runtime

2. 初始化 Dapr

虽然 Dapr 也可以在非 Docker 环境下运行,但是官方更推荐使用 Docker,首先确保机器上已经安装有 Docker 环境,然后执行下面的 dapr init 命令:

[root@localhost ~]# dapr init
> Making the jump to hyperspace...
>> Installing runtime version 1.6.1
Dapr runtime installed to /root/.dapr/bin, you may run the following to add it to your path if you want to run daprd directly:
    export PATH=$PATH:/root/.dapr/bin
> Downloading binaries and setting up components...
> Downloaded binaries and completed components set up.
>> daprd binary has been installed to /root/.dapr/bin.
>> dapr_placement container is running.
>> dapr_redis container is running.
>> dapr_zipkin container is running.
>> Use `docker ps` to check running containers.
> Success! Dapr is up and running. To get started, go here: https://aka.ms/dapr-getting-started

从运行结果可以看到,Dapr 的初始化过程包含以下几个部分:

  • 安装 Dapr 运行时(daprd),安装位置为 /root/.dapr/bin,同时会创建一个 components 目录用于默认组件的定义
  • 运行 dapr_placement 容器,dapr placement 服务 用于实现本地 actor 支持
  • 运行 dapr_redis 容器,用于本地状态存储(local state store)和消息代理(message broker
  • 运行 dapr_zipkin 容器,用于实现服务的可观察性(observability

初始化完成后,再次使用 dapr -v 校验是否安装成功:

[root@localhost ~]# dapr -v
CLI version: 1.6.0 
Runtime version: 1.6.1

并使用 docker ps 查看容器运行状态:

[root@localhost ~]# docker ps
CONTAINER ID   IMAGE               COMMAND                  CREATED             STATUS                       PORTS                                                 NAMES
63dd751ec5eb   daprio/dapr:1.6.1   "./placement"            About an hour ago   Up About an hour             0.0.0.0:50005->50005/tcp, :::50005->50005/tcp         dapr_placement
a8d3a7c93e12   redis               "docker-entrypoint.s…"   About an hour ago   Up About an hour             0.0.0.0:6379->6379/tcp, :::6379->6379/tcp             dapr_redis
52586882abea   openzipkin/zipkin   "start-zipkin"           About an hour ago   Up About an hour (healthy)   9410/tcp, 0.0.0.0:9411->9411/tcp, :::9411->9411/tcp   dapr_zipkin

使用 Dapr API

dapr run 是最常用的 Dapr 命令之一, 这个命令用于启动一个应用,同时启动一个 Dapr 边车进程,你也可以不指定应用,只启动 Dapr 边车:

[root@localhost ~]# dapr run --app-id myapp --dapr-http-port 3500
WARNING: no application command found.
ℹ️  Starting Dapr with id myapp. HTTP Port: 3500. gRPC Port: 39736
ℹ️  Checking if Dapr sidecar is listening on HTTP port 3500
INFO[0000] starting Dapr Runtime -- version 1.6.1 -- commit 2fa6bd832d34f5a78c5e336190207d46b761093a  app_id=myapp instance=localhost.localdomain scope=dapr.runtime type=log ver=1.6.1
INFO[0000] log level set to: info                        app_id=myapp instance=localhost.localdomain scope=dapr.runtime type=log ver=1.6.1
INFO[0000] metrics server started on :46773/             app_id=myapp instance=localhost.localdomain scope=dapr.metrics type=log ver=1.6.1
INFO[0000] standalone mode configured                    app_id=myapp instance=localhost.localdomain scope=dapr.runtime type=log ver=1.6.1
INFO[0000] app id: myapp                                 app_id=myapp instance=localhost.localdomain scope=dapr.runtime type=log ver=1.6.1
INFO[0000] mTLS is disabled. Skipping certificate request and tls validation  app_id=myapp instance=localhost.localdomain scope=dapr.runtime type=log ver=1.6.1
INFO[0000] local service entry announced: myapp -> 10.0.2.8:45527  app_id=myapp instance=localhost.localdomain scope=dapr.contrib type=log ver=1.6.1
INFO[0000] Initialized name resolution to mdns           app_id=myapp instance=localhost.localdomain scope=dapr.runtime type=log ver=1.6.1
INFO[0000] loading components                            app_id=myapp instance=localhost.localdomain scope=dapr.runtime type=log ver=1.6.1
INFO[0000] component loaded. name: pubsub, type: pubsub.redis/v1  app_id=myapp instance=localhost.localdomain scope=dapr.runtime type=log ver=1.6.1
INFO[0000] waiting for all outstanding components to be processed  app_id=myapp instance=localhost.localdomain scope=dapr.runtime type=log ver=1.6.1
INFO[0000] detected actor state store: statestore        app_id=myapp instance=localhost.localdomain scope=dapr.runtime type=log ver=1.6.1
INFO[0000] component loaded. name: statestore, type: state.redis/v1  app_id=myapp instance=localhost.localdomain scope=dapr.runtime type=log ver=1.6.1
INFO[0000] all outstanding components processed          app_id=myapp instance=localhost.localdomain scope=dapr.runtime type=log ver=1.6.1
INFO[0000] enabled gRPC tracing middleware               app_id=myapp instance=localhost.localdomain scope=dapr.runtime.grpc.api type=log ver=1.6.1
INFO[0000] enabled gRPC metrics middleware               app_id=myapp instance=localhost.localdomain scope=dapr.runtime.grpc.api type=log ver=1.6.1
INFO[0000] API gRPC server is running on port 39736      app_id=myapp instance=localhost.localdomain scope=dapr.runtime type=log ver=1.6.1
INFO[0000] enabled metrics http middleware               app_id=myapp instance=localhost.localdomain scope=dapr.runtime.http type=log ver=1.6.1
INFO[0000] enabled tracing http middleware               app_id=myapp instance=localhost.localdomain scope=dapr.runtime.http type=log ver=1.6.1
INFO[0000] http server is running on port 3500           app_id=myapp instance=localhost.localdomain scope=dapr.runtime type=log ver=1.6.1
INFO[0000] The request body size parameter is: 4         app_id=myapp instance=localhost.localdomain scope=dapr.runtime type=log ver=1.6.1
INFO[0000] enabled gRPC tracing middleware               app_id=myapp instance=localhost.localdomain scope=dapr.runtime.grpc.internal type=log ver=1.6.1
INFO[0000] enabled gRPC metrics middleware               app_id=myapp instance=localhost.localdomain scope=dapr.runtime.grpc.internal type=log ver=1.6.1
INFO[0000] internal gRPC server is running on port 45527  app_id=myapp instance=localhost.localdomain scope=dapr.runtime type=log ver=1.6.1
WARN[0000] app channel is not initialized. did you make sure to configure an app-port?  app_id=myapp instance=localhost.localdomain scope=dapr.runtime type=log ver=1.6.1
INFO[0000] actor runtime started. actor idle timeout: 1h0m0s. actor scan interval: 30s  app_id=myapp instance=localhost.localdomain scope=dapr.runtime.actor type=log ver=1.6.1
WARN[0000] app channel not initialized, make sure -app-port is specified if pubsub subscription is required  app_id=myapp instance=localhost.localdomain scope=dapr.runtime type=log ver=1.6.1
WARN[0000] failed to read from bindings: app channel not initialized   app_id=myapp instance=localhost.localdomain scope=dapr.runtime type=log ver=1.6.1
INFO[0000] dapr initialized. Status: Running. Init Elapsed 267.56237799999997ms  app_id=myapp instance=localhost.localdomain scope=dapr.runtime type=log ver=1.6.1
ℹ️  Checking if Dapr sidecar is listening on GRPC port 39736
ℹ️  Dapr sidecar is up and running.
✅  You're up and running! Dapr logs will appear here.

INFO[0002] placement tables updated, version: 0          app_id=myapp instance=localhost.localdomain scope=dapr.runtime.actor.internal.placement type=log ver=1.6.1

上面的命令通过参数 --app-id myapp 启动了一个名为 myapp 的空白应用,并让 Dapr 监听 3500 HTTP 端口(--dapr-http-port 3500)。由于没有指定组件目录,Dapr 会使用 dapr init 时创建的默认组件定义,可以在 /root/.dapr/components 目录查看:

[root@localhost ~]# ls /root/.dapr/components
pubsub.yaml  statestore.yaml

这个目录默认有两个组件:pubsub 和 statestore。我们查看组件的定义,可以发现两个组件都是基于 Redis 实现的。

pubsub 定义:

apiVersion: dapr.io/v1alpha1
kind: Component
metadata:
  name: pubsub
spec:
  type: pubsub.redis
  version: v1
  metadata:
  - name: redisHost
    value: localhost:6379
  - name: redisPassword
    value: ""

statestore 定义:

apiVersion: dapr.io/v1alpha1
kind: Component
metadata:
  name: statestore
spec:
  type: state.redis
  version: v1
  metadata:
  - name: redisHost
    value: localhost:6379
  - name: redisPassword
    value: ""
  - name: actorStateStore
    value: "true"

statestore 组件可以为分布式应用提供状态管理功能,你可以使用 Dapr 的状态管理 API 来对状态进行保存、读取和查询等。通过配置,Dapr 支持 不同类型的存储后端,如:Redis、MySQL、MongoDB、Zookeeper 等,如下图所示:
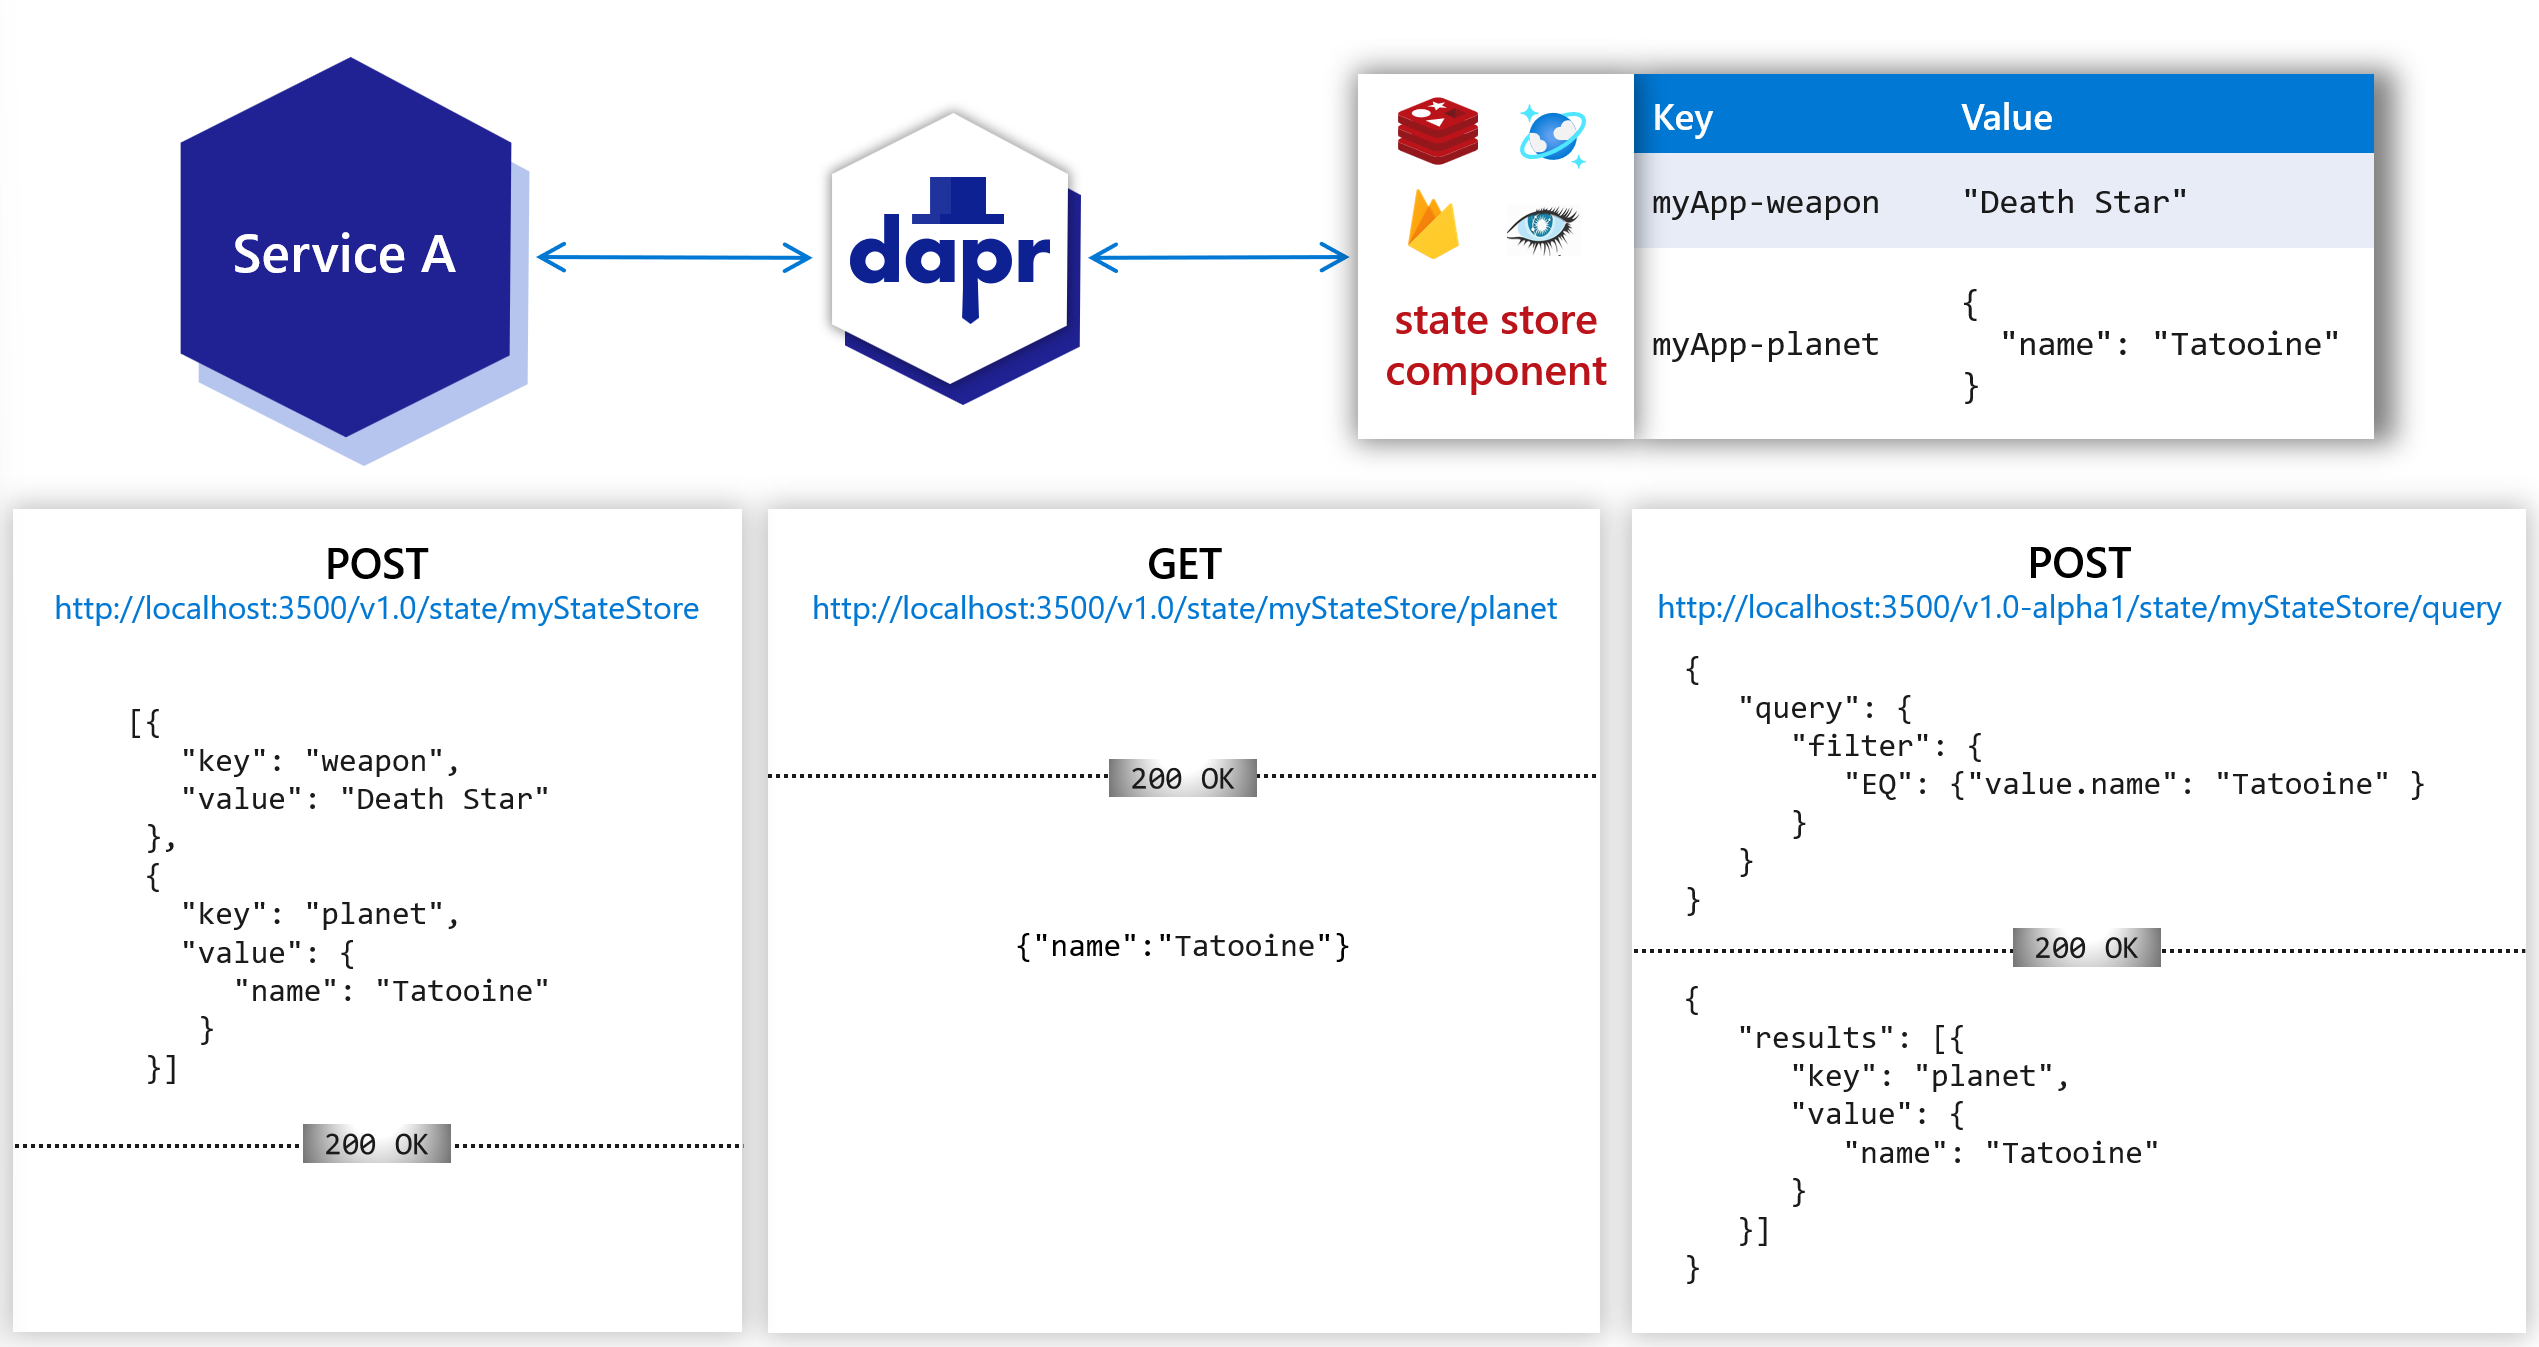
state-management-overview.png

下面我们来体验下 Dapr 的状态管理 API。

使用 POST 请求向 statestore 中保存一个 keynamevalueBruce Wayne 的键值对(注意这里的 statestore 必须和组件定义中的 name 一致):

[root@localhost ~]# curl -X POST -H "Content-Type: application/json" -d '[{ "key": "name", "value": "Bruce Wayne"}]' http://localhost:3500/v1.0/state/statestore

使用 GET 请求查询 statestorekeyname 的值:

[root@localhost ~]# curl http://localhost:3500/v1.0/state/statestore/name
"Bruce Wayne"

为了进一步了解状态信息是如何保存在 Redis 中的,可以使用下面的命令进到容器里查看:

[root@localhost ~]# docker exec -it dapr_redis redis-cli
127.0.0.1:6379> keys *
1) "myapp||name"
127.0.0.1:6379> hgetall myapp||name
1) "data"
2) "\"Bruce Wayne\""
3) "version"
4) "1"
127.0.0.1:6379> exit

组件和构建块

Dapr 有两个基本概念我们需要了解:组件(component)构建块(building block)。每个组件代表一个原子功能,有一个接口定义,并且可以有不同的实现,比如 statestore 组件,可以使用 Redis 实现,也可以使用 MySQL 实现。而构建块是基于一个或多个组件实现的一套用于在分布式系统中使用的 API 接口(HTTP 或 gRPC),比如上面的例子中我们使用的接口 /v1.0/state/** 就是 一个 State management 构建块,它是由 statestore 组件组成的,而这个 statestore 组件是由 Redis 实现的。下面是构建块和组件的示例图:
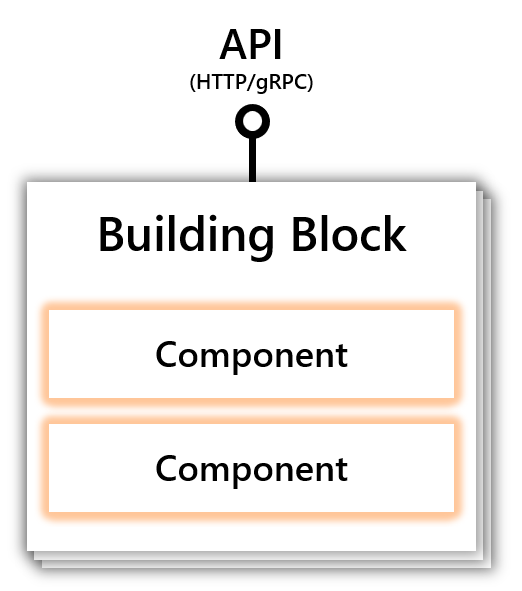
concepts-building-blocks.png

Dapr 提供了下面这些组件:

可以在 这里 查看 Dapr 支持的组件接口定义和实现。

Dapr 提供了下面这些构建块:

下面我们来体验下最常用的两个构建块:Service-to-service invocationPublish and subscribe

服务调用(Service-to-service Invocation)

使用 Dapr 的服务调用构建块,可以让你的应用可靠并安全地与其他应用进行通信。
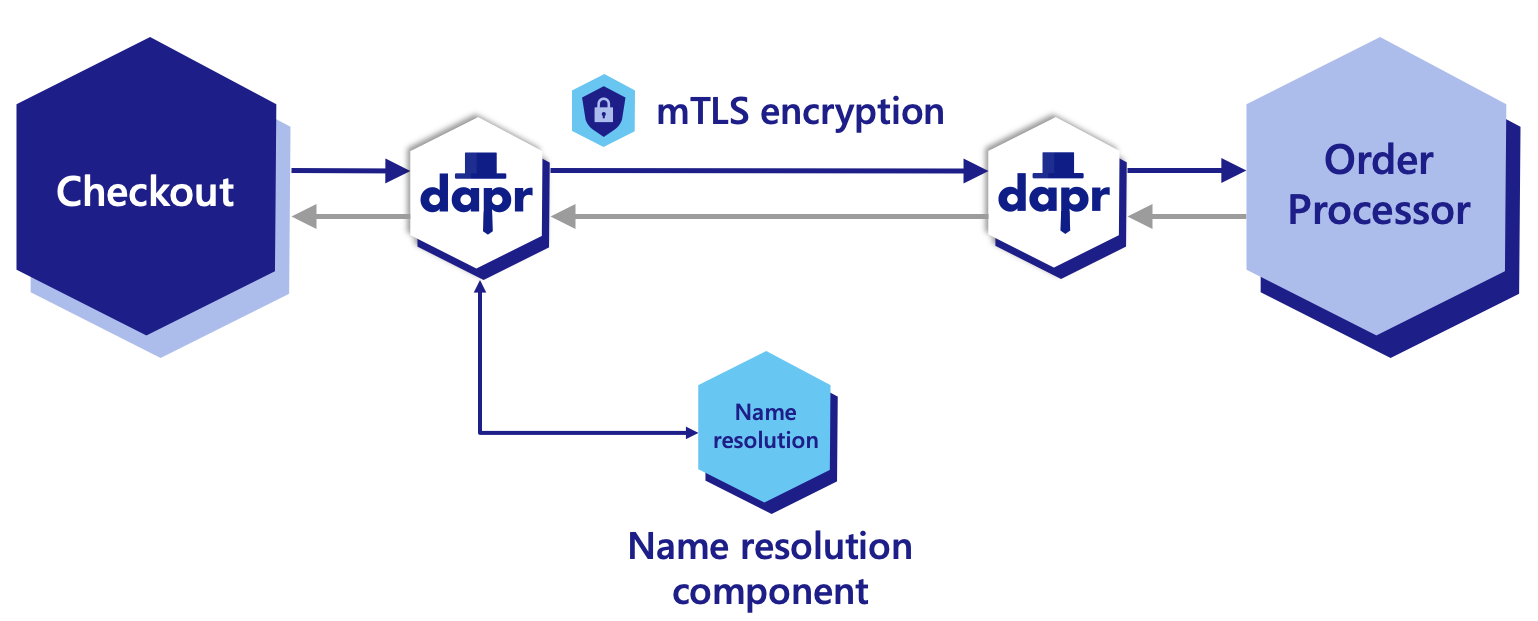
service-invocation-overview.png

Dapr 采用了边车架构,每个应用都有一个 Dapr 作为反向代理,在调用其他应用时,实际上是调用本应用的 Dapr 代理,并由 Dapr 来调用其他应用的 Dapr 代理,最后请求到你要调用的应用。这样做的好处是由 Dapr 来管理你的所有请求,实现了下面这些特性:

  • 命名空间隔离(Namespace scoping)
  • 服务调用安全(Service-to-service security)
  • 访问控制(Access control)
  • 重试(Retries)
  • 插件化的服务发现机制(Pluggable service discovery)
  • mDNS 负载均衡(Round robin load balancing with mDNS)
  • 链路跟踪和监控指标(Tracing and metrics with observability)
  • 服务调用 API(Service invocation API)
  • gRPC 代理(gRPC proxying)

关于服务调用构建块,官方提供了多种语言的示例,可以下载下面的源码后,在 service_invocation 目录下找到你需要的语言:

[root@localhost ~]# git clone https://github.com/dapr/quickstarts.git

这里我们使用 Java 的示例来体验一下 Dapr 的服务调用,首先使用 mvn clean package 分别构建 checkoutorder-processor 两个项目,得到 CheckoutService-0.0.1-SNAPSHOT.jarOrderProcessingService-0.0.1-SNAPSHOT.jar 两个文件。

我们先使用 dapr run 启动 order-processor 服务:

[root@localhost ~]# dapr run --app-id order-processor \
  --app-port 6001 \
  --app-protocol http \
  --dapr-http-port 3501 \
  -- java -jar target/OrderProcessingService-0.0.1-SNAPSHOT.jar

这时我们同时启动了两个进程,Dapr 服务监听在 3501 端口,order-processor 服务监听在 6001 端口。order-processor 服务是一个非常简单的 Spring Boot Web 项目,暴露了一个 /orders API 模拟订单处理流程,我们可以使用 curl 直接访问它的接口:

[root@localhost ~]# curl -H Content-Type:application/json \
  -X POST \
  --data '{"orderId":"123"}' \
  http://127.0.0.1:6001/orders

当然这里我们更希望通过 Dapr 来调用它的接口:

[root@localhost ~]# curl -H Content-Type:application/json \
  -H dapr-app-id:order-processor \
  -X POST \
  --data '{"orderId":"123"}' \
  http://127.0.0.1:3501/orders

这里我们请求的是 Dapr 代理的端口,接口地址仍然是 /orders,特别注意的是,我们在请求里加了一个 dapr-app-id 头部,它的值就是我们要调用的应用 ID order-processor。但是这种做法官方是不推荐的,官方推荐每个应用都调用自己的 Dapr 代理,而不要去调别人的 Dapr 代理。

于是我们使用 dapr run 启动 checkout 服务:

[root@localhost ~]# dapr run --app-id checkout \
  --app-protocol http \
  --dapr-http-port 3500 \
  -- java -jar target/CheckoutService-0.0.1-SNAPSHOT.jar

这个命令同样会启动两个进程,checkout 服务是一个简单的命令行程序,它的 Dapr 代理服务监听在 3500 端口,可以看到想让 checkout 调用 order-processor,只需要调用它自己的 Dapr 代理即可,并在请求里加了一个 dapr-app-id 头部:

private static final String DAPR_HTTP_PORT = System.getenv().getOrDefault("DAPR_HTTP_PORT", "3500");

public static void main(String[] args) throws InterruptedException, IOException {
  String dapr_url = "http://localhost:"+DAPR_HTTP_PORT+"/orders";
  for (int i=1; i<=10; i++) {
    int orderId = i;
    JSONObject obj = new JSONObject();
    obj.put("orderId", orderId);

    HttpRequest request = HttpRequest.newBuilder()
        .POST(HttpRequest.BodyPublishers.ofString(obj.toString()))
        .uri(URI.create(dapr_url))
        .header("Content-Type", "application/json")
        .header("dapr-app-id", "order-processor")
        .build();

    HttpResponse<String> response = httpClient.send(request, HttpResponse.BodyHandlers.ofString());
    System.out.println("Order passed: "+ orderId);
    TimeUnit.MILLISECONDS.sleep(1000);
  }
}

我们还可以使用同一个 app-id 启动多个实例(要注意端口号不要和之前的冲突):

[root@localhost ~]# dapr run --app-id order-processor \
  --app-port 6002 \
  --app-protocol http \
  --dapr-http-port 3502 \
  -- java -jar target/OrderProcessingService-0.0.1-SNAPSHOT.jar --server.port=6002

这样在请求 order-processor 服务时,Dapr 会为我们自动进行负载均衡。

发布订阅(Publish and Subscribe)

在分布式系统中,发布订阅是另一种常见的服务模型,应用之间通过消息或事件来进行通信,而不是直接调用,可以实现应用之间的解耦。

Dapr 的发布订阅构建块如下图所示:
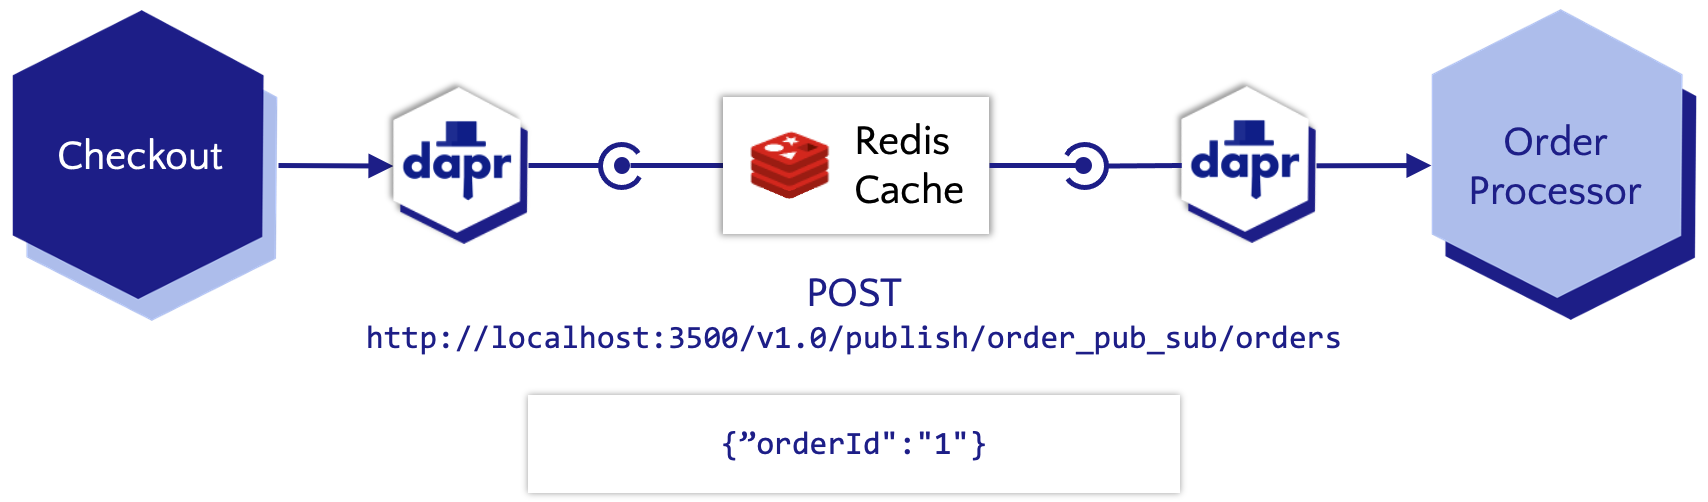
pubsub-diagram.png

和上面一样,我们使用 Java 语言的示例来体验一下 Dapr 的发布订阅。使用 mvn clean package 分别构建 checkoutorder-processor 两个项目,得到 CheckoutService-0.0.1-SNAPSHOT.jarOrderProcessingService-0.0.1-SNAPSHOT.jar 两个文件。

使用 dapr run 启动 order-processor 服务:

[root@localhost ~]# dapr run --app-id order-processor \
  --app-port 6001 \
  --components-path ./components \
  -- java -jar target/OrderProcessingService-0.0.1-SNAPSHOT.jar

和上面的服务调用示例相比,少了 --app-protocol http--dapr-http-port 3501 两个参数,这是因为我们不再使用 HTTP 来进行服务间调用了,而是改成通过消息来进行通信。既然是消息通信,那么就少不了消息中间件,Dapr 支持常见的消息中间件来作为 Pub/sub brokers,如:Kafka、RabbitMQ、Redis 等。

我们在 components 目录下准备了一个 pubsub.yaml 文件,在这里对 Pub/sub brokers 组件进行配置:

apiVersion: dapr.io/v1alpha1
kind: Component
metadata:
  name: order_pub_sub
spec:
  type: pubsub.redis
  version: v1
  metadata:
  - name: redisHost
    value: localhost:6379
  - name: redisPassword
    value: ""

其中,metadata.name 定义了组件名称为 order_pub_sub,应用就是使用这个名称来和组件进行通信的;spec.type 定义了组件类型是 pubsub,并使用 redis 实现;spec.metadata 为组件的一些配置信息。

在运行 dapr run 时,通过 --components-path 参数来指定应用运行所需要的组件的定义,components 目录下可同时包含多个组件定义。

和之前的例子一样,order-processor 服务是一个非常简单的 Spring Boot Web 项目,它仍然是暴露 /orders 接口来模拟订单处理流程,我们可以使用 curl 直接访问它的接口:

[root@localhost ~]# curl -H Content-Type:application/json \
  -X POST \
  --data '{"data":{"orderId":"123"}}' \
  http://127.0.0.1:6001/orders

不过这里的数据结构发生了一点变化,对于消息通信的应用,Dapr 使用了一个统一的类来表示接受到的消息:

public class SubscriptionData<T> {
    private T data;
}

查看 order-processor 的日志,可以看到它成功接收到了订单:

== APP == 2022-04-03 16:26:27.265  INFO 16263 --- [nio-6001-exec-6] c.s.c.OrderProcessingServiceController   : Subscriber received: 123

既然 order-processor 也是使用 /orders 接口,那和服务调用的例子有啥区别呢?仔细翻看代码我们可以发现,order-processor 除了有一个 /orders 接口,还新增了一个 /dapr/subscribe 接口:

@GetMapping(path = "/dapr/subscribe", produces = MediaType.APPLICATION_JSON_VALUE)
public DaprSubscription[] getSubscription() {
    DaprSubscription daprSubscription = DaprSubscription.builder()
            .pubSubName("order_pub_sub")
            .topic("orders")
            .route("orders")
            .build();
    logger.info("Subscribed to Pubsubname {} and topic {}", "order_pub_sub", "orders");
    DaprSubscription[] arr = new DaprSubscription[]{daprSubscription};
    return arr;
}

这是一个简单的 GET 接口,直接返回下面这样的数据:

[
    {
        "pubSubName": "order_pub_sub",
        "topic": "orders",
        "route": "orders"
    }
]

这实际上是 Dapr 的一种接口规范,被称为 Programmatically subscriptions(编程式订阅)。Dapr 在启动时会调用这个接口,这样 Dapr 就知道你的应用需要订阅什么主题,接受到消息后通过什么接口来处理。

除了编程式订阅,Dapr 还支持一种被称为 Declarative subscriptions(声明式订阅)的方式,这种方式的好处是对代码没有侵入性,可以不改任何代码就能将一个已有应用改造成主题订阅的模式。我们将声明式订阅定义在 subscription.yaml 文件中:

apiVersion: dapr.io/v1alpha1
kind: Subscription
metadata:
  name: order-pub-sub
spec:
  topic: orders
  route: orders
  pubsubname: order_pub_sub
scopes:
- order-processor
- checkout

声明式订阅和编程式订阅的效果是一样的,其目的都是让 Dapr 订阅 某个 Pub/subpubsubname: order_pub_sub)的 某个主题topic: orders),并将接受到的消息路由到 某个接口route: orders)来处理。区别在于,声明式订阅方便一个主题注册多个应用,编程式订阅方便一个应用注册多个主题。

我们使用 dapr publish 发布一个消息:

[root@localhost ~]# dapr publish --publish-app-id order-processor \
  --pubsub order_pub_sub \
  --topic orders \
  --data '{"orderId": 100}'
✅  Event published successfully

查看 order-processor 的日志,可以看到它又一次成功接收到了订单。这一次我们不是直接调用 /orders 接口,而是通过 order-processor 的 Dapr 将消息发送到 Redis,同时 order-processor 的 Dapr 通过订阅接受到该消息,并转发给 /orders 接口。

实际上这里我偷懒了,发布和订阅用的都是 order-processor 的 Dapr,在真实场景下,发布者会使用发布者自己的 Dapr。我们启一个新的 Dapr 实例(注意使用和 order-processor 相同的组件):

[root@localhost ~]# dapr run --app-id checkout \
  --dapr-http-port 3601 \
  --components-path ./components/

然后通过 checkout 发布消息:

[root@localhost ~]# dapr publish --publish-app-id checkout \
  --pubsub order_pub_sub \
  --topic orders \
  --data '{"orderId": 100}'
✅  Event published successfully

到这里我们实现了两个 Dapr 之间的消息通信,一个 Dapr 发布消息,另一个 Dapr
订阅消息,并将接受到的消息转发给我们的应用接口。不过这里我们是使用 dapr publish 命令来发布消息的,在我们的应用代码中,当然不能使用这种方式,而应用使用发布订阅构建块提供的接口。

我们使用 dapr run 启动 checkout 服务:

[root@localhost ~]# dapr run --app-id checkout \
  --components-path ./components \
  -- java -jar target/CheckoutService-0.0.1-SNAPSHOT.jar

查看 checkout 和 order-processor 的日志,它们分别完成了订单信息的发布和接受处理。浏览代码可以发现,checkout 服务其实使用了发布订阅构建块提供的 /v1.0/publish 接口:

private static final String PUBSUB_NAME = "order_pub_sub";
private static final String TOPIC = "orders";
private static String DAPR_HOST = System.getenv().getOrDefault("DAPR_HOST", "http://localhost");
private static String DAPR_HTTP_PORT = System.getenv().getOrDefault("DAPR_HTTP_PORT", "3500");

public static void main(String[] args) throws InterruptedException, IOException {
    String uri = DAPR_HOST +":"+ DAPR_HTTP_PORT + "/v1.0/publish/"+PUBSUB_NAME+"/"+TOPIC;
    for (int i = 0; i <= 10; i++) {
        int orderId = i;
        JSONObject obj = new JSONObject();
        obj.put("orderId", orderId);

        // Publish an event/message using Dapr PubSub via HTTP Post
        HttpRequest request = HttpRequest.newBuilder()
                .POST(HttpRequest.BodyPublishers.ofString(obj.toString()))
                .uri(URI.create(uri))
                .header("Content-Type", "application/json")
                .build();

        HttpResponse<String> response = httpClient.send(request, HttpResponse.BodyHandlers.ofString());
        logger.info("Published data: {}", orderId);
        TimeUnit.MILLISECONDS.sleep(3000);
    }
}

知道原理后,使用 curl 命令也可以模拟出完全相同的请求:

[root@localhost ~]# curl -H Content-Type:application/json \
  -X POST \
  --data '{"orderId": "100"}' \
  http://localhost:3601/v1.0/publish/order_pub_sub/orders

参考

  1. https://github.com/dapr/dapr
  2. Dapr 官方文档
  3. Dapr 知多少 | 分布式应用运行时

更多

1. Dapr Tutorials

https://docs.dapr.io/getting-started/tutorials/

2. Dapr 组件一览

  • State stores

    • Aerospike
    • Apache Cassandra
    • Couchbase
    • Hashicorp Consul
    • Hazelcast
    • Memcached
    • MongoDB
    • MySQL
    • PostgreSQL
    • Redis
    • RethinkDB
    • Zookeeper
    • AWS DynamoDB
    • GCP Firestore
    • Azure Blob Storage
    • Azure CosmosDB
    • Azure SQL Server
    • Azure Table Storage
    • OCI Object Storage
  • Name resolution

    • HashiCorp Consul
    • mDNS
    • Kubernetes
  • Pub/sub brokers

    • Apache Kafka
    • Hazelcast
    • MQTT
    • NATS Streaming
    • In Memory
    • JetStream
    • Pulsar
    • RabbitMQ
    • Redis Streams
    • AWS SNS/SQS
    • GCP Pub/Sub
    • Azure Event Hubs
    • Azure Service Bus
  • Bindings

    • Apple Push Notifications (APN)
    • Cron (Scheduler)
    • GraphQL
    • HTTP
    • InfluxDB
    • Kafka
    • Kubernetes Events
    • Local Storage
    • MQTT
    • MySQL
    • PostgreSql
    • Postmark
    • RabbitMQ
    • Redis
    • SMTP
    • Twilio
    • Twitter
    • SendGrid
    • Alibaba Cloud DingTalk
    • Alibaba Cloud OSS
    • Alibaba Cloud Tablestore
    • AWS DynamoDB
    • AWS S3
    • AWS SES
    • AWS SNS
    • AWS SQS
    • AWS Kinesis
    • GCP Cloud Pub/Sub
    • GCP Storage Bucket
    • Azure Blob Storage
    • Azure CosmosDB
    • Azure CosmosDBGremlinAPI
    • Azure Event Grid
    • Azure Event Hubs
    • Azure Service Bus Queues
    • Azure SignalR
    • Azure Storage Queues
    • Zeebe Command
    • Zeebe Job Worker
  • Secret stores

    • Local environment variables
    • Local file
    • HashiCorp Vault
    • Kubernetes secrets
    • AWS Secrets Manager
    • AWS SSM Parameter Store
    • GCP Secret Manager
    • Azure Key Vault
    • AlibabaCloud OOS Parameter Store
  • Configuration stores

    • Redis
  • Middleware

    • Rate limit
    • OAuth2
    • OAuth2 client credentials
    • Bearer
    • Open Policy Agent
    • Uppercase

3. 开发自己的组件

https://github.com/dapr/components-contrib/blob/master/docs/developing-component.md
使用 Spring 项目脚手架

在我们的日常工作中,经常需要从头开始创建一个 Spring 项目,很多人的做法是,复制一份已有的项目,然后改目录名,改项目名,改包名,然后再把一些不要的文件删掉,只保留项目的基本框架。

实际上,这样操作后保留下来的基本框架代码就是 脚手架 代码,有很多的工具可以帮我们自动生成脚手架代码。

Maven Archetype

说起项目脚手架,我们最先想到的肯定是 Maven Archetype,在命令行中输入 mvn archetype:generate 进入交互模式,默认情况下会列出所有的 Archetype,这个清单可能非常长,让你不知道选哪个,可以通过 -Dfilter 参数进行过滤:

> mvn archetype:generate -Dfilter=org.apache.maven:
[INFO] Scanning for projects...
[INFO]
[INFO] ------------------< org.apache.maven:standalone-pom >-------------------
[INFO] Building Maven Stub Project (No POM) 1
[INFO] --------------------------------[ pom ]---------------------------------
[INFO]
[INFO] >>> maven-archetype-plugin:3.2.1:generate (default-cli) > generate-sources @ standalone-pom >>>
[INFO]
[INFO] <<< maven-archetype-plugin:3.2.1:generate (default-cli) < generate-sources @ standalone-pom <<<
[INFO]
[INFO]
[INFO] --- maven-archetype-plugin:3.2.1:generate (default-cli) @ standalone-pom ---
[INFO] Generating project in Interactive mode
[INFO] No archetype defined. Using maven-archetype-quickstart (org.apache.maven.archetypes:maven-archetype-quickstart:1.0)
Choose archetype:
1: remote -> org.apache.maven.archetypes:maven-archetype-archetype (An archetype which contains a sample archetype.)
2: remote -> org.apache.maven.archetypes:maven-archetype-j2ee-simple (An archetype which contains a simplified sample J2EE application.)
3: remote -> org.apache.maven.archetypes:maven-archetype-marmalade-mojo (-)
4: remote -> org.apache.maven.archetypes:maven-archetype-mojo (An archetype which contains a sample a sample Maven plugin.)
5: remote -> org.apache.maven.archetypes:maven-archetype-plugin (An archetype which contains a sample Maven plugin.)
6: remote -> org.apache.maven.archetypes:maven-archetype-plugin-site (An archetype which contains a sample Maven plugin site. This archetype can be layered upon an
    existing Maven plugin project.)
7: remote -> org.apache.maven.archetypes:maven-archetype-portlet (An archetype which contains a sample JSR-268 Portlet.)
8: remote -> org.apache.maven.archetypes:maven-archetype-profiles (-)
9: remote -> org.apache.maven.archetypes:maven-archetype-quickstart (An archetype which contains a sample Maven project.)
10: remote -> org.apache.maven.archetypes:maven-archetype-simple (An archetype which contains a simple Maven project.)
11: remote -> org.apache.maven.archetypes:maven-archetype-site (An archetype which contains a sample Maven site which demonstrates some of the supported document types like
    APT, XDoc, and FML and demonstrates how to i18n your site. This archetype can be layered
    upon an existing Maven project.)
12: remote -> org.apache.maven.archetypes:maven-archetype-site-simple (An archetype which contains a sample Maven site.)
13: remote -> org.apache.maven.archetypes:maven-archetype-site-skin (An archetype which contains a sample Maven Site Skin.)
14: remote -> org.apache.maven.archetypes:maven-archetype-webapp (An archetype which contains a sample Maven Webapp project.)
Choose a number or apply filter (format: [groupId:]artifactId, case sensitive contains): 9:

我们这边使用 -Dfilter=org.apache.maven: 过滤条件列出了 Maven 官方的 14 个 Archetype,系统默认会选中 maven-archetype-quickstart,这是官方推荐的 Maven 项目脚手架,然后我们需要选择版本号,并填写项目的 groupIdartifactIdversionpackage

Choose org.apache.maven.archetypes:maven-archetype-quickstart version:
1: 1.0-alpha-1
2: 1.0-alpha-2
3: 1.0-alpha-3
4: 1.0-alpha-4
5: 1.0
6: 1.1
7: 1.3
8: 1.4
Choose a number: 8:

Define value for property 'groupId': com.example
Define value for property 'artifactId': demo
Define value for property 'version' 1.0-SNAPSHOT: :
Define value for property 'package' com.example: :
Confirm properties configuration:
groupId: com.example
artifactId: demo
version: 1.0-SNAPSHOT
package: com.example
 Y: : Y
[INFO] ----------------------------------------------------------------------------
[INFO] Using following parameters for creating project from Archetype: maven-archetype-quickstart:1.4
[INFO] ----------------------------------------------------------------------------
[INFO] Parameter: groupId, Value: com.example
[INFO] Parameter: artifactId, Value: demo
[INFO] Parameter: version, Value: 1.0-SNAPSHOT
[INFO] Parameter: package, Value: com.example
[INFO] Parameter: packageInPathFormat, Value: com/example
[INFO] Parameter: package, Value: com.example
[INFO] Parameter: groupId, Value: com.example
[INFO] Parameter: artifactId, Value: demo
[INFO] Parameter: version, Value: 1.0-SNAPSHOT
[INFO] Project created from Archetype in dir: C:\Users\aneasystone\Desktop\demo
[INFO] ------------------------------------------------------------------------
[INFO] BUILD SUCCESS
[INFO] ------------------------------------------------------------------------
[INFO] Total time:  04:07 min
[INFO] Finished at: 2022-03-17T07:04:14+08:00
[INFO] ------------------------------------------------------------------------

这样,一个简单的 Maven 项目就生成了,生成的项目结构如下:

$ tree demo
demo
├── pom.xml
└── src
    ├── main
    │   └── java
    │       └── com
    │           └── example
    │               └── App.java
    └── test
        └── java
            └── com
                └── example
                    └── AppTest.java

当然,这个示例代码还是太简单了,我们希望能能自动生成一个 Spring Boot 项目的代码框架,好在 Spring 官方也提供了很多种不同的 Maven Archetype,通过 -Dfilter=org.springframework: 参数过滤下看看:

Choose archetype:
1: remote -> org.springframework.boot:spring-boot-sample-actuator-archetype (Spring Boot Actuator Sample)
2: remote -> org.springframework.boot:spring-boot-sample-actuator-log4j-archetype (Spring Boot Actuator Log4J Sample)
3: remote -> org.springframework.boot:spring-boot-sample-actuator-noweb-archetype (Spring Boot Actuator Non-Web Sample)
4: remote -> org.springframework.boot:spring-boot-sample-actuator-ui-archetype (Spring Boot Actuator UI Sample)
5: remote -> org.springframework.boot:spring-boot-sample-amqp-archetype (Spring Boot AMQP Sample)
6: remote -> org.springframework.boot:spring-boot-sample-aop-archetype (Spring Boot AOP Sample)
7: remote -> org.springframework.boot:spring-boot-sample-batch-archetype (Spring Boot Batch Sample)
8: remote -> org.springframework.boot:spring-boot-sample-data-jpa-archetype (Spring Boot Data JPA Sample)
9: remote -> org.springframework.boot:spring-boot-sample-data-mongodb-archetype (Spring Boot Data MongoDB Sample)
10: remote -> org.springframework.boot:spring-boot-sample-data-redis-archetype (Spring Boot Data Redis Sample)
11: remote -> org.springframework.boot:spring-boot-sample-data-rest-archetype (Spring Boot Data REST Sample)
12: remote -> org.springframework.boot:spring-boot-sample-integration-archetype (Spring Boot Integration Sample)
13: remote -> org.springframework.boot:spring-boot-sample-jetty-archetype (Spring Boot Jetty Sample)
14: remote -> org.springframework.boot:spring-boot-sample-profile-archetype (Spring Boot Profile Sample)
15: remote -> org.springframework.boot:spring-boot-sample-secure-archetype (Spring Boot Security Sample)
16: remote -> org.springframework.boot:spring-boot-sample-servlet-archetype (Spring Boot Servlet Sample)
17: remote -> org.springframework.boot:spring-boot-sample-simple-archetype (Spring Boot Simple Sample)
18: remote -> org.springframework.boot:spring-boot-sample-tomcat-archetype (Spring Boot Tomcat Sample)
19: remote -> org.springframework.boot:spring-boot-sample-traditional-archetype (Spring Boot Traditional Sample)
20: remote -> org.springframework.boot:spring-boot-sample-web-jsp-archetype (Spring Boot Web JSP Sample)
21: remote -> org.springframework.boot:spring-boot-sample-web-method-security-archetype (Spring Boot Web Method Security Sample)
22: remote -> org.springframework.boot:spring-boot-sample-web-secure-archetype (Spring Boot Web Secure Sample)
23: remote -> org.springframework.boot:spring-boot-sample-web-static-archetype (Spring Boot Web Static Sample)
24: remote -> org.springframework.boot:spring-boot-sample-web-ui-archetype (Spring Boot Web UI Sample)
25: remote -> org.springframework.boot:spring-boot-sample-websocket-archetype (Spring Boot WebSocket Sample)
26: remote -> org.springframework.boot:spring-boot-sample-xml-archetype (Spring Boot XML Sample)
27: remote -> org.springframework.osgi:spring-osgi-bundle-archetype (Spring OSGi Maven2 Archetype)
28: remote -> org.springframework.ws:spring-ws-archetype (Spring Web Services Maven2 Archetype.)

我们选择 spring-boot-sample-simple-archetype 就可以生成一个简单的 Spring Boot 项目,生成的项目结构如下:

$ tree demo
demo
├── build.gradle
├── pom.xml
└── src
    ├── main
    │   ├── java
    │   │   └── com
    │   │       └── example
    │   │           └── simple
    │   │               ├── SampleSimpleApplication.java
    │   │               └── service
    │   │                   └── HelloWorldService.java
    │   └── resources
    │       └── application.properties
    └── test
        ├── java
        │   └── com
        │       └── example
        │           └── simple
        │               ├── SampleSimpleApplicationTests.java
        │               └── SpringTestSampleSimpleApplicationTests.java
        └── resources
            └── application.properties

我们也可以不用交互模式,直接一行命令生成:

$ mvn archetype:generate \
     -DarchetypeGroupId=org.springframework.boot \
     -DarchetypeArtifactId=spring-boot-sample-simple-archetype \
     -DarchetypeVersion=1.0.2.RELEASE \
     -DgroupId=com.example \
     -DartifactId=demo \
     -Dversion=1.0.0-SNAPSHOT \
     -DinteractiveMode=false

除了官方的 Maven Archetype,网上还有很多人自己写的 Archetype,集成了一些常用的框架和工具,也值得尝试:

Spring Initializr

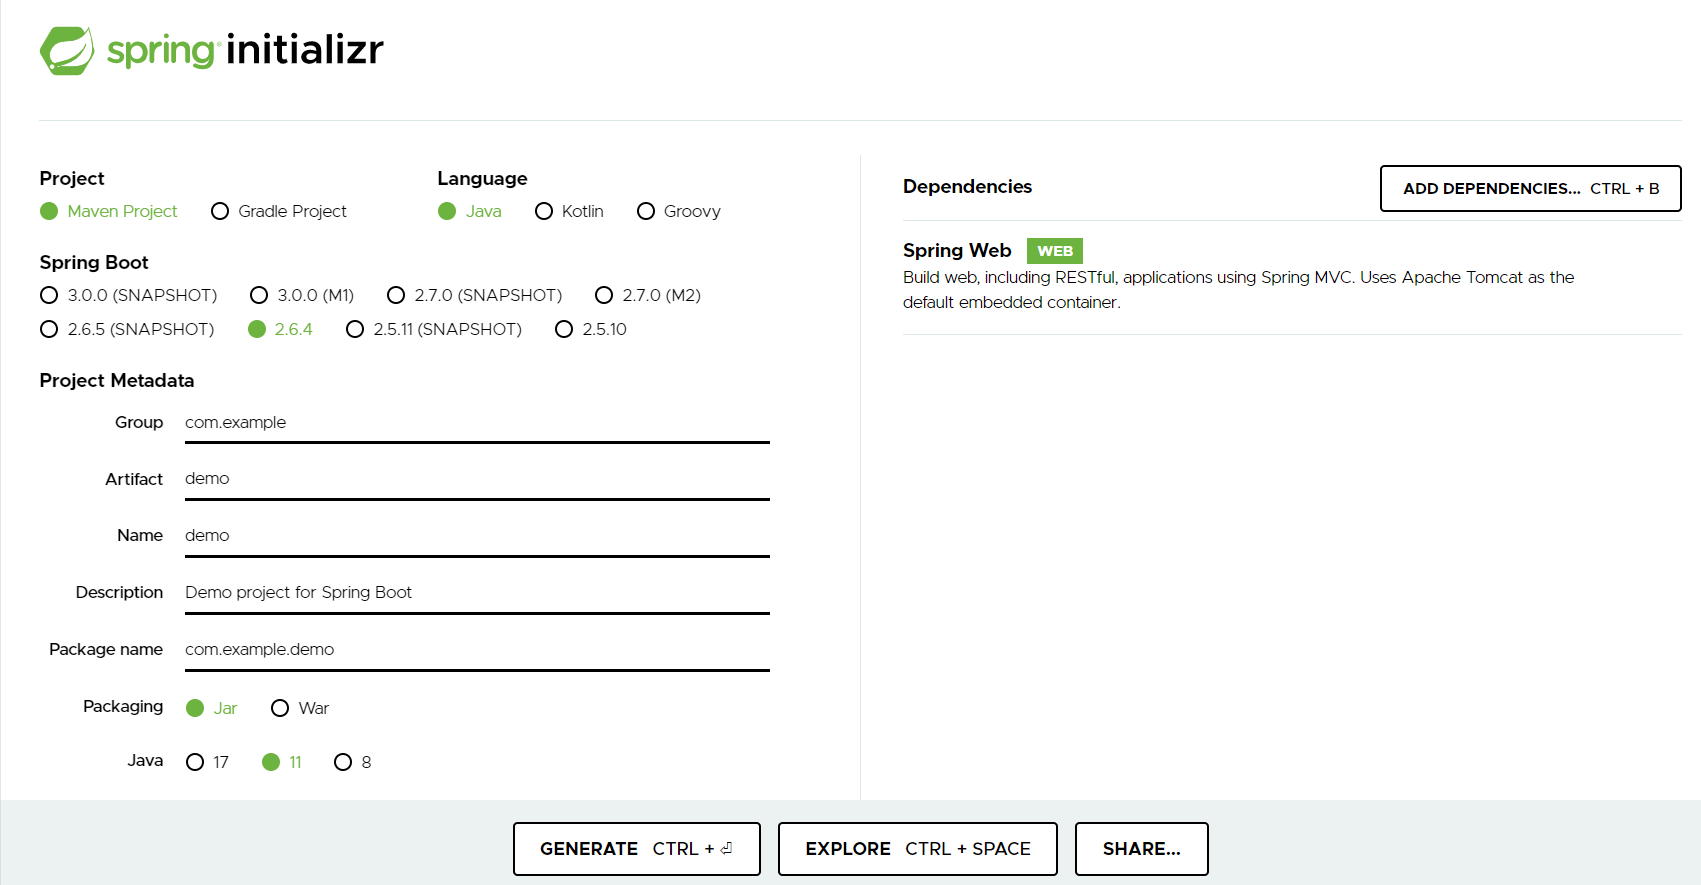
虽然使用 Maven Archetype 创建 Spring 项目非常简单,但是通过 Maven Archetype 生成的代码比较死板,如果想在生成的时候动态添加一些依赖,就需要手工去修改 pom.xml 文件了。Spring 官方提供了另一种创建项目的方式:Spring Initializr,下图是使用 Spring Initializr 生成项目脚手架代码的一个示例:

spring-initializr.png

在这个页面中,我们需要填写这些信息:

  • 项目类型

    • Maven
    • Gradle
  • 语言类型

    • Java
    • Kotlin
    • Groovy
  • Spring Boot 版本
  • 项目基本信息

    • Group
    • Artifact
    • Name
    • Description
    • Package name
    • Packaging
    • Java
  • 项目依赖

这里我选择的是 Maven 项目,语言类型为 Java,Spring Boot 版本为 2.6.4,项目基本信息为默认的 demo,打包方式为 jar,并添加了一个 Spring Web 依赖。生成的项目代码结构如下:

demo
├── HELP.md
├── mvnw
├── mvnw.cmd
├── pom.xml
└── src
    ├── main
    │   ├── java
    │   │   └── com
    │   │       └── example
    │   │           └── demo
    │   │               └── DemoApplication.java
    │   └── resources
    │       ├── application.properties
    │       ├── static
    │       └── templates
    └── test
        └── java
            └── com
                └── example
                    └── demo
                        └── DemoApplicationTests.java

按照 Spring Boot 快速入门教程,我们在 DemoApplication.java 里加几行代码:

package com.example.demo;

import org.springframework.boot.SpringApplication;
import org.springframework.boot.autoconfigure.SpringBootApplication;
import org.springframework.web.bind.annotation.GetMapping;
import org.springframework.web.bind.annotation.RequestParam;
import org.springframework.web.bind.annotation.RestController;

@SpringBootApplication
@RestController
public class DemoApplication {

    public static void main(String[] args) {
        SpringApplication.run(DemoApplication.class, args);
    }

    @GetMapping("/hello")
    public String hello(@RequestParam(value = "name", defaultValue = "World") String name) {
        return String.format("Hello %s!", name);
    }
}

至此一个简单的 Web 项目就完成了,然后执行 ./mvnw spring-boot:run 命令,第一次执行可能比较慢,这是在下载程序所需要的依赖,等启动结束后打开浏览器,访问 http://localhost:8080/hello 页面,就可以看到我们熟悉的 Hello World 了。

Spring Tool Suite

Spring Tool Suite 被简称为 STS,是 Spring 官方推出的一套用于方便开发 Spring 项目的工具集,它可以集成到几乎所有的 IDE 中,比如:Eclipse、VS Code 或 Theia IDE 等。

这里以 VS Code 为例,体验下使用 STS 快速创建 Spring 项目脚手架代码。首先在 VS Code 的插件市场搜索 Spring Boot Extension Pack

vscode-sts.png

可以看到 STS 是一套工具集,包含了:

  • Spring Boot Tools
  • Spring Boot Dashboard
  • Spring Initializr Java Support

如果我们只想体验 Spring Initializr 的功能,也可以只安装 Spring Initializr Java Support 这个插件即可。安装完成后,通过 Ctrl + Shift + P 打开命令面板,输入 Spring Initializr 按提示就可以快速创建一个 Spring 项目,放一张官方的动图:

Spring Boot CLI

Spring Boot CLI 的安装非常方便,我们可以直接从 Spring 仓库中下载 spring-boot-cli-2.6.4-bin.zip,将其解压到某个目录中,然后将 bin 目录添加到 PATH 环境变量。

使用 spring --version 验证 Spring Boot CLI 是否安装成功:

> spring --version
Spring CLI v2.6.4

Spring Boot CLI 可以用来执行 Groovy 脚本,也可以用来初始化新的 Spring 项目。下面是一个执行 Groovy 脚本的例子,首先创建一个文件 hello.groovy

@RestController
class ThisWillActuallyRun {
    @RequestMapping("/")
    String home() {
        "Hello World!"
    }
}

然后执行命令:

> spring run hello.groovy

这样,一个简单的 Web 项目就启动好了,Spring Boot CLI 会自动解析 Groovy 脚本中的依赖并运行,打开浏览器访问 http://localhost:8080 就看见我们熟悉的 Hello World 了。

下面是通过 Spring Boot CLI 初始化项目的例子:

> spring init --name demo \
    --artifact-id demo \
    --group-id com.example \
    --language java \
    --java-version 11 \
    --boot-version 2.6.4 \
    --type maven-project \
    --dependencies web \
    demo

这个命令和从 start.spring.io 上生成项目是完全一样的。可以通过 spring help init 了解各个参数的含义,每个参数都有默认值,所以你也可以直接使用 spring init demo 生成一个默认的示例项目。

参考

  1. Introduction to Archetypes
  2. Spring Quickstart Guide
  3. Spring Initializr Reference Guide
  4. Spring Boot Reference Documentation

更多

1. 创建自己的 Maven Archetype

2. Spring Initializr 支持的依赖一览

在 Spring Initializr 上创建项目时,可以手工添加项目依赖,支持的依赖列表如下(记住这些依赖,大多是 Spring 生态中必学必会的技术):

Developer Tools

  • Spring Native

    • Incubating support for compiling Spring applications to native executables using the GraalVM native-image compiler.
  • Spring Boot DevTools

    • Provides fast application restarts, LiveReload, and configurations for enhanced development experience.
  • Lombok

    • Java annotation library which helps to reduce boilerplate code.
  • Spring Configuration Processor

    • Generate metadata for developers to offer contextual help and "code completion" when working with custom configuration keys (ex.application.properties/.yml files).

Web

  • Spring Web

    • Build web, including RESTful, applications using Spring MVC. Uses Apache Tomcat as the default embedded container.
  • Spring Reactive Web

    • Build reactive web applications with Spring WebFlux and Netty.
  • Spring GraphQL

    • Build GraphQL applications with Spring GraphQL and GraphQL Java.
  • Rest Repositories

    • Exposing Spring Data repositories over REST via Spring Data REST.
  • Spring Session

    • Provides an API and implementations for managing user session information.
  • Rest Repositories HAL Explorer

    • Browsing Spring Data REST repositories in your browser.
  • Spring HATEOAS

    • Eases the creation of RESTful APIs that follow the HATEOAS principle when working with Spring / Spring MVC.
  • Spring Web Services

    • Facilitates contract-first SOAP development. Allows for the creation of flexible web services using one of the many ways to manipulate XML payloads.
  • Jersey

    • Framework for developing RESTful Web Services in Java that provides support for JAX-RS APIs.
  • Vaadin

    • A web framework that allows you to write UI in pure Java without getting bogged down in JS, HTML, and CSS.

Template Engines

  • Thymeleaf

    • A modern server-side Java template engine for both web and standalone environments. Allows HTML to be correctly displayed in browsers and as static prototypes.
  • Apache Freemarker

    • Java library to generate text output (HTML web pages, e-mails, configuration files, source code, etc.) based on templates and changing data.
  • Mustache

    • Logic-less Templates. There are no if statements, else clauses, or for loops. Instead there are only tags.
  • Groovy Templates

    • Groovy templating engine.

Security

  • Spring Security

    • Highly customizable authentication and access-control framework for Spring applications.
  • OAuth2 Client

    • Spring Boot integration for Spring Security's OAuth2/OpenID Connect client features.
  • OAuth2 Resource Server

    • Spring Boot integration for Spring Security's OAuth2 resource server features.
  • Spring LDAP

    • Makes it easier to build Spring based applications that use the Lightweight Directory Access Protocol.
  • Okta

    • Okta specific configuration for Spring Security/Spring Boot OAuth2 features. Enable your Spring Boot application to work with Okta via OAuth 2.0/OIDC.

SQL

  • JDBC API

    • Database Connectivity API that defines how a client may connect and query a database.
  • Spring Data JPA

    • Persist data in SQL stores with Java Persistence API using Spring Data and Hibernate.
  • Spring Data JDBC

    • Persist data in SQL stores with plain JDBC using Spring Data.
  • Spring Data R2DBC

    • Provides Reactive Relational Database Connectivity to persist data in SQL stores using Spring Data in reactive applications.
  • MyBatis Framework

    • Persistence framework with support for custom SQL, stored procedures and advanced mappings. MyBatis couples objects with stored procedures or SQL statements using a XML descriptor or annotations.
  • Liquibase Migration

    • Liquibase database migration and source control library.
  • Flyway Migration

    • Version control for your database so you can migrate from any version (incl. an empty database) to the latest version of the schema.
  • JOOQ Access Layer

    • Generate Java code from your database and build type safe SQL queries through a fluent API.
  • IBM DB2 Driver

    • A JDBC driver that provides access to IBM DB2.
  • Apache Derby Database

    • An open source relational database implemented entirely in Java.
  • H2 Database

    • Provides a fast in-memory database that supports JDBC API and R2DBC access, with a small (2mb) footprint. Supports embedded and server modes as well as a browser based console application.
  • HyperSQL Database

    • Lightweight 100% Java SQL Database Engine.
  • MariaDB Driver

    • MariaDB JDBC and R2DBC driver.
  • MS SQL Server Driver

    • A JDBC and R2DBC driver that provides access to Microsoft SQL Server and Azure SQL Database from any Java application.
  • MySQL Driver

    • MySQL JDBC and R2DBC driver.
  • Oracle Driver

    • A JDBC driver that provides access to Oracle.
  • PostgreSQL Driver

    • A JDBC and R2DBC driver that allows Java programs to connect to a PostgreSQL database using standard, database independent Java code.

NoSQL

  • Spring Data Redis (Access+Driver)

    • Advanced and thread-safe Java Redis client for synchronous, asynchronous, and reactive usage. Supports Cluster, Sentinel, Pipelining, Auto-Reconnect, Codecs and much more.
  • Spring Data Reactive Redis

    • Access Redis key-value data stores in a reactive fashion with Spring Data Redis.
  • Spring Data MongoDB

    • Store data in flexible, JSON-like documents, meaning fields can vary from document to document and data structure can be changed over time.
  • Spring Data Reactive MongoDB

    • Provides asynchronous stream processing with non-blocking back pressure for MongoDB.
  • Spring Data Elasticsearch (Access+Driver)

    • A distributed, RESTful search and analytics engine with Spring Data Elasticsearch.
  • Spring Data for Apache Cassandra

    • A free and open-source, distributed, NoSQL database management system that offers high-scalability and high-performance.
  • Spring Data Reactive for Apache Cassandra

    • Access Cassandra NoSQL Database in a reactive fashion.
  • Spring for Apache Geode

    • Apache Geode is a data management platform that helps users build real-time, highly concurrent, highly performant and reliable Spring Boot applications at scale that is compatible with Pivotal Cloud Cache.
  • Spring Data Couchbase

    • NoSQL document-oriented database that offers in memory-first architecture, geo-distributed deployments, and workload isolation.
  • Spring Data Reactive Couchbase

    • Access Couchbase NoSQL database in a reactive fashion with Spring Data Couchbase.
  • Spring Data Neo4j

    • An open source NoSQL database that stores data structured as graphs consisting of nodes, connected by relationships.

Messaging

  • Spring Integration

    • Adds support for Enterprise Integration Patterns. Enables lightweight messaging and supports integration with external systems via declarative adapters.
  • Spring for RabbitMQ

    • Gives your applications a common platform to send and receive messages, and your messages a safe place to live until received.
  • Spring for Apache Kafka

    • Publish, subscribe, store, and process streams of records.
  • Spring for Apache Kafka Streams

    • Building stream processing applications with Apache Kafka Streams.
  • Spring for Apache ActiveMQ 5

    • Spring JMS support with Apache ActiveMQ 'Classic'.
  • Spring for Apache ActiveMQ Artemis

    • Spring JMS support with Apache ActiveMQ Artemis.
  • WebSocket

    • Build WebSocket applications with SockJS and STOMP.
  • RSocket

    • RSocket.io applications with Spring Messaging and Netty.
  • Apache Camel

    • Apache Camel is an open source integration framework that empowers you to quickly and easily integrate various systems consuming or producing data.
  • Solace PubSub+

    • Connect to a Solace PubSub+ Advanced Event Broker to publish, subscribe, request/reply and store/replay messages

I/O

  • Spring Batch

    • Batch applications with transactions, retry/skip and chunk based processing.
  • Validation

    • Bean Validation with Hibernate validator.
  • Java Mail Sender

    • Send email using Java Mail and Spring Framework's JavaMailSender.
  • Quartz Scheduler

    • Schedule jobs using Quartz.
  • Spring cache abstraction

    • Provides cache-related operations, such as the ability to update the content of the cache, but does not provide the actual data store.
  • Picocli

    • Build command line applications with picocli.

Ops

  • Spring Boot Actuator

    • Supports built in (or custom) endpoints that let you monitor and manage your application - such as application health, metrics, sessions, etc.
  • Codecentric's Spring Boot Admin (Client)

    • Required for your application to register with a Codecentric's Spring Boot Admin Server instance.
  • Codecentric's Spring Boot Admin (Server)

    • A community project to manage and monitor your Spring Boot applications. Provides a UI on top of the Spring Boot Actuator endpoints.

Observability

  • Datadog

    • Publish Micrometer metrics to Datadog, a dimensional time-series SaaS with built-in dashboarding and alerting.
  • Influx

    • Publish Micrometer metrics to InfluxDB, a dimensional time-series server that support real-time stream processing of data.
  • Graphite

    • Publish Micrometer metrics to Graphite, a hierarchical metrics system backed by a fixed-size database.
  • New Relic

    • Publish Micrometer metrics to New Relic, a SaaS offering with a full UI and a query language called NRQL.
  • Prometheus

    • Expose Micrometer metrics in Prometheus format, an in-memory dimensional time series database with a simple built-in UI, a custom query language, and math operations.
  • Sleuth

    • Distributed tracing via logs with Spring Cloud Sleuth.
  • Wavefront

    • Publish Micrometer metrics to Tanzu Observability by Wavefront, a SaaS-based metrics monitoring and analytics platform that lets you visualize, query, and alert over data from across your entire stack.
  • Zipkin Client

    • Distributed tracing with an existing Zipkin installation and Spring Cloud Sleuth Zipkin.

Testing

  • Spring REST Docs

    • Document RESTful services by combining hand-written with Asciidoctor and auto-generated snippets produced with Spring MVC Test.
  • Testcontainers

    • Provide lightweight, throwaway instances of common databases, Selenium web browsers, or anything else that can run in a Docker container.
  • Contract Verifier

    • Moves TDD to the level of software architecture by enabling Consumer Driven Contract (CDC) development.
  • Contract Stub Runner

    • Stub Runner for HTTP/Messaging based communication. Allows creating WireMock stubs from RestDocs tests.
  • Embedded LDAP Server

    • Provides a platform neutral way for running a LDAP server in unit tests.
  • Embedded MongoDB Database

    • Provides a platform neutral way for running MongoDB in unit tests.

Spring Cloud

  • Cloud Bootstrap

    • Non-specific Spring Cloud features, unrelated to external libraries or integrations (e.g. Bootstrap context and @RefreshScope).
  • Function

    • Promotes the implementation of business logic via functions and supports a uniform programming model across serverless providers, as well as the ability to run standalone (locally or in a PaaS).
  • Task

    • Allows a user to develop and run short lived microservices using Spring Cloud. Run them locally, in the cloud, and on Spring Cloud Data Flow.

Spring Cloud Tools

  • Open Service Broker

    • Framework for building Spring Boot apps that implement the Open Service Broker API, which can deliver services to applications running within cloud native platforms such as Cloud Foundry, Kubernetes and OpenShift.

Spring Cloud Config

  • Config Client

    • Client that connects to a Spring Cloud Config Server to fetch the application's configuration.
  • Config Server

    • Central management for configuration via Git, SVN, or HashiCorp Vault.
  • Vault Configuration

    • Provides client-side support for externalized configuration in a distributed system. Using HashiCorp's Vault you have a central place to manage external secret properties for applications across all environments.
  • Apache Zookeeper Configuration

    • Enable and configure common patterns inside your application and build large distributed systems with Apache Zookeeper based components. The provided patterns include Service Discovery and Configuration.
  • Consul Configuration

    • Enable and configure the common patterns inside your application and build large distributed systems with Hashicorp’s Consul. The patterns provided include Service Discovery, Distributed Configuration and Control Bus.

Spring Cloud Discovery

  • Eureka Discovery Client

    • A REST based service for locating services for the purpose of load balancing and failover of middle-tier servers.
  • Eureka Server

    • spring-cloud-netflix Eureka Server.
  • Apache Zookeeper Discovery

    • Service discovery with Apache Zookeeper.
  • Cloud Foundry Discovery

    • Service discovery with Cloud Foundry.
  • Consul Discovery

    • Service discovery with Hashicorp Consul.

Spring Cloud Routing

  • Gateway

    • Provides a simple, yet effective way to route to APIs and provide cross cutting concerns to them such as security, monitoring/metrics, and resiliency.
  • OpenFeign

    • Declarative REST Client. OpenFeign creates a dynamic implementation of an interface decorated with JAX-RS or Spring MVC annotations.
  • Cloud LoadBalancer

    • Client-side load-balancing with Spring Cloud LoadBalancer.

Spring Cloud Circuit Breaker

  • Resilience4J

    • Spring Cloud Circuit breaker with Resilience4j as the underlying implementation.

Spring Cloud Messaging

  • Cloud Bus

    • Links nodes of a distributed system with a lightweight message broker which can used to broadcast state changes or other management instructions (requires a binder, e.g. Apache Kafka or RabbitMQ).
  • Cloud Stream

    • Framework for building highly scalable event-driven microservices connected with shared messaging systems (requires a binder, e.g. Apache Kafka, RabbitMQ or Solace PubSub+).

VMware Tanzu Application Service

  • Config Client (TAS)

    • Config client on VMware Tanzu Application Service.
  • Service Registry (TAS)

    • Eureka service discovery client on VMware Tanzu Application Service.

Microsoft Azure

  • Azure Support

    • Auto-configuration for Azure Services (Service Bus, Storage, Active Directory, Key Vault, and more).
  • Azure Active Directory

    • Spring Security integration with Azure Active Directory for authentication.
  • Azure Cosmos DB

    • Fully managed NoSQL database service for modern app development, including Spring Data support.
  • Azure Key Vault

    • Manage application secrets.
  • Azure Storage

    • Azure Storage service integration.

Google Cloud Platform

  • GCP Support

    • Contains auto-configuration support for every Spring Cloud GCP integration. Most of the auto-configuration code is only enabled if other dependencies are added to the classpath.
  • GCP Messaging

    • Adds the GCP Support entry and all the required dependencies so that the Google Cloud Pub/Sub integration work out of the box.
  • GCP Storage

    • Adds the GCP Support entry and all the required dependencies so that the Google Cloud Storage integration work out of the box.

3. 实现自己的 Spring Initializr

Spring Initializr 是一个完全开源的项目,我们可以通过它实现自己的代码脚手架。上面所介绍的 start.spring.io、STS 和 Spring Boot CLI 其实都是通过 Spring Initializr 来实现的,源码如下:

# git clone https://github.com/spring-io/initializr
# git clone https://github.com/spring-io/start.spring.io

另外,阿里的知行动手实验室也基于 Spring Initializr 做了一个类似于 start.spring.io 的脚手架生成站点 start.aliyun.com,在依赖列表中新增了阿里的一些开源项目,而且还提供了常见的几种应用架构的代码示例,有兴趣的同学可以体验下。

4. mvnw 设置代理

直接使用 mvn 命令构建项目时,可以通过 Maven 的配置文件 ~/.m2/settings.xml 来配置代理服务器,如下:

  <proxies>
    <proxy>
      <id>optional</id>
      <active>true</active>
      <protocol>http</protocol>
      <host>localhost</host>
      <port>10809</port>
    </proxy>
  </proxies>

但是使用 mvnw 时,它会自动下载 Maven 并执行而不会使用 settings.xml 中的 Maven 配置。这时我们可以通过 MAVEN_OPTS 环境变量来设置代理:

export MAVEN_OPTS="-Dhttp.proxyHost=127.0.0.1 -Dhttp.proxyPort=10809 -Dhttps.proxyHost=127.0.0.1 -Dhttps.proxyPort=10809"

或者在 .mvn 目录下新建一个 jvm.config 文件:

-Dhttp.proxyHost=127.0.0.1
-Dhttp.proxyPort=10809
-Dhttps.proxyHost=127.0.0.1
-Dhttps.proxyPort=10809

在 VirtualBox 上安装 Docker 服务

在 VirtualBox 上安装 CentOS 实验环境 中,我们在 VirtualBox 上安装了 CentOS 实验环境,这一节我们会继续在这个环境上安装 Docker 服务。

1. 使用 XShell 连接虚拟机

在虚拟机里进行几次操作之后,我们发现,由于这个系统是纯命令行界面,无法使用 VirtualBox 的增强功能,比如共享文件夹、共享剪切板等,每次想从虚拟机中复制一段文本出来都非常麻烦。所以,如果能从虚拟机外面用 XShell 登录进行操作,那就完美了。

我们首先登录虚拟机,查看 IP:

[root@localhost ~]# ip addr
1: lo: <LOOPBACK,UP,LOWER_UP> mtu 65536 qdisc noqueue state UNKNOWN group default qlen 1000
    link/loopback 00:00:00:00:00:00 brd 00:00:00:00:00:00
    inet 127.0.0.1/8 scope host lo
       valid_lft forever preferred_lft forever
    inet6 ::1/128 scope host 
       valid_lft forever preferred_lft forever
2: enp0s3: <BROADCAST,MULTICAST,UP,LOWER_UP> mtu 1500 qdisc pfifo_fast state UP group default qlen 1000
    link/ether 08:00:27:c1:96:99 brd ff:ff:ff:ff:ff:ff
    inet 10.0.2.6/24 brd 10.0.2.255 scope global noprefixroute dynamic enp0s3
       valid_lft 453sec preferred_lft 453sec
    inet6 fe80::e0ae:69af:54a5:f8d0/64 scope link noprefixroute 
       valid_lft forever preferred_lft forever

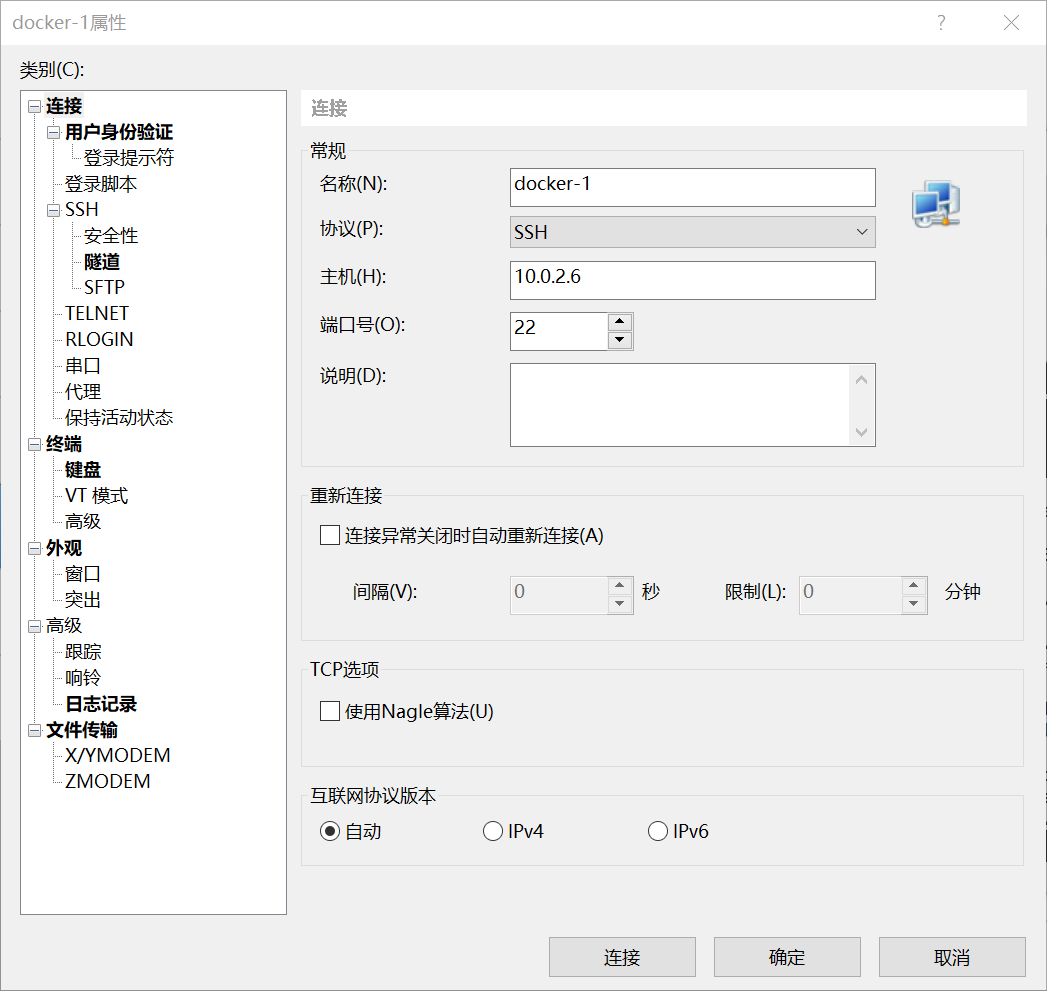
然后使用 XShell 连接 10.0.2.6 的 22 端口:

xshell-docker-1.png

可是却发现连接不了:

Connecting to 10.0.2.6:22...
Could not connect to '10.0.2.6' (port 22): Connection failed.

通过复习 在 VirtualBox 上安装 CentOS 实验环境 的内容,我们知道目前我们使用的 VirtualBox 的网络模式是 NAT 网络,在这种网络模式下,宿主机是无法直接访问虚拟机的,而要通过 端口转发(Port Forwarding)

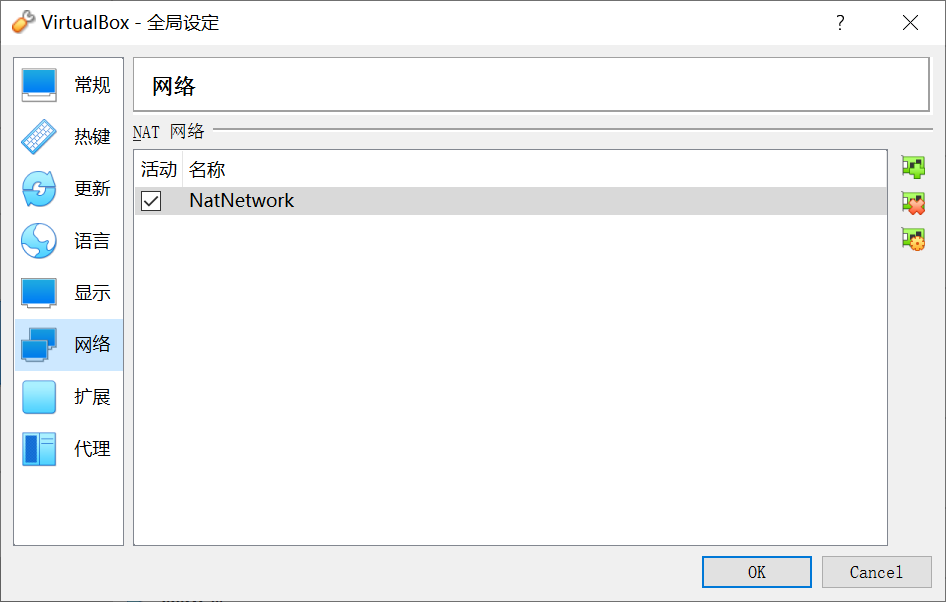
我们打开 VirtualBox “管理” -> “全局设定” 菜单,找到 “网络” 选项卡,在这里能看到我们使用的 NAT 网络:

virtualbox-network-setting.png

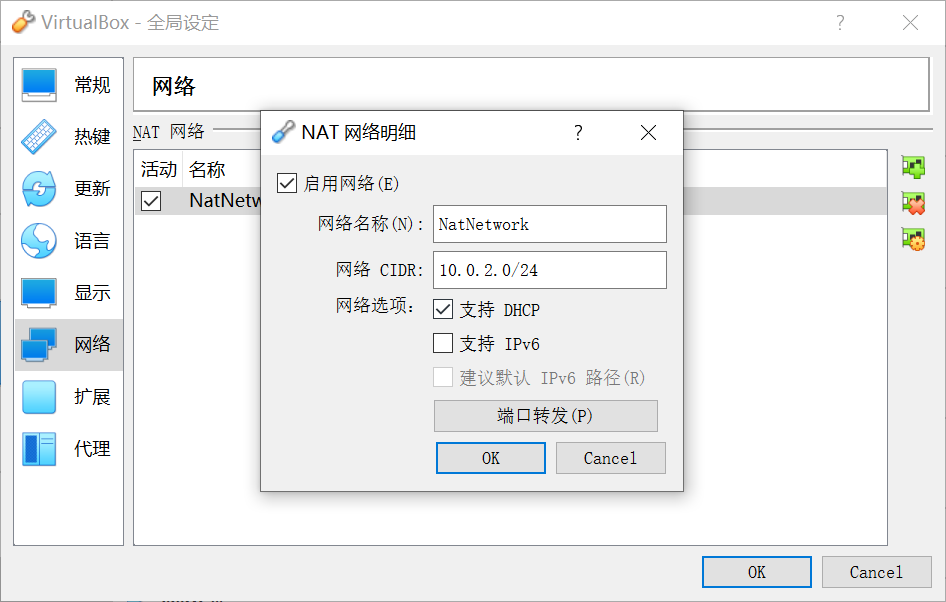
双击 NatNetwork 打开 NAT 网络的配置:

virtualbox-network-setting-2.png

会发现下面有一个 端口转发 的按钮,在这里我们可以定义从宿主机到虚拟机的端口映射:

virtualbox-nat-port-forwarding.png

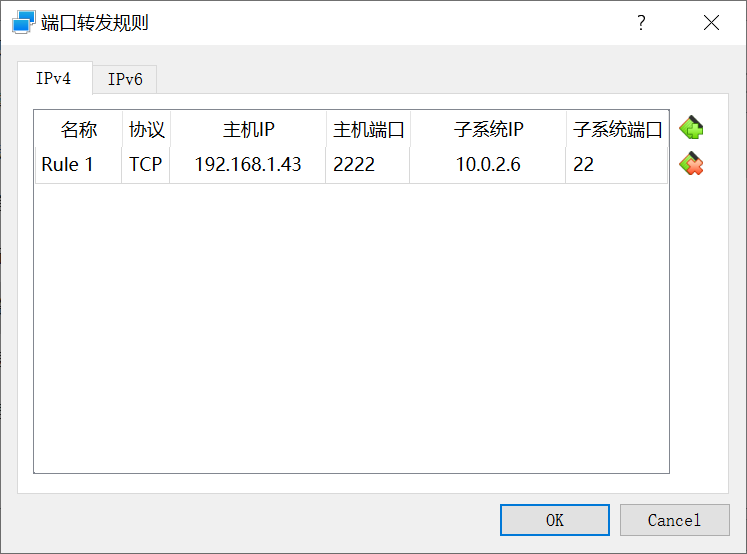
我们新增这样一条规则:

  • 协议: TCP
  • 主机:192.168.1.43:2222
  • 子系统:10.0.2.6:22

这表示 VirtualBox 会监听宿主机 192.168.1.43 的 2222 端口,并将 2222 端口的请求转发到 10.0.2.6 这台虚拟机的 22 端口。

我们使用 XShell 连接 192.168.1.43:2222,这一次成功进入了:

Connecting to 192.168.1.43:2222...
Connection established.
To escape to local shell, press 'Ctrl+Alt+]'.

WARNING! The remote SSH server rejected X11 forwarding request.
Last login: Mon Feb 21 06:49:44 2022
[root@localhost ~]#

2. 通过 yum 安装 Docker

系统默认的仓库里是没有 Docker 服务的:

[root@localhost ~]# ls /etc/yum.repos.d/
CentOS-Base.repo  CentOS-Debuginfo.repo  CentOS-Media.repo    CentOS-Vault.repo
CentOS-CR.repo    CentOS-fasttrack.repo  CentOS-Sources.repo  CentOS-x86_64-kernel.repo

我们需要先在系统中添加 Docker 仓库,可以直接将仓库文件下载下来放到 /etc/yum.repos.d/ 目录,也可以通过 yum-config-manager 命令来添加。

先安装 yum-utils

[root@localhost ~]# yum install -y yum-utils

再通过 yum-config-manager 添加 Docker 仓库:

[root@localhost ~]# yum-config-manager --add-repo https://download.docker.com/linux/centos/docker-ce.repo
已加载插件:fastestmirror
adding repo from: https://download.docker.com/linux/centos/docker-ce.repo
grabbing file https://download.docker.com/linux/centos/docker-ce.repo to /etc/yum.repos.d/docker-ce.repo
repo saved to /etc/yum.repos.d/docker-ce.repo

接下来我们继续安装 Docker 服务:

[root@localhost ~]# yum install docker-ce docker-ce-cli containerd.io

安装过程根据提示输入 y 确认即可,另外,还会提示你校验 GPG 密钥,正常情况下这个密钥的指纹应该是 060a 61c5 1b55 8a7f 742b 77aa c52f eb6b 621e 9f35

从 https://download.docker.com/linux/centos/gpg 检索密钥
导入 GPG key 0x621E9F35:
 用户ID     : "Docker Release (CE rpm) <docker@docker.com>"
 指纹       : 060a 61c5 1b55 8a7f 742b 77aa c52f eb6b 621e 9f35
 来自       : https://download.docker.com/linux/centos/gpg
是否继续?[y/N]:y

如果安装顺利,就可以通过 systemctl start docker 启动 Docker 服务了,然后运行 docker run hello-world 验证 Docker 服务是否正常:

[root@localhost ~]# systemctl start docker
[root@localhost ~]# docker run hello-world
Unable to find image 'hello-world:latest' locally
latest: Pulling from library/hello-world
2db29710123e: Pull complete 
Digest: sha256:97a379f4f88575512824f3b352bc03cd75e239179eea0fecc38e597b2209f49a
Status: Downloaded newer image for hello-world:latest

Hello from Docker!
This message shows that your installation appears to be working correctly.

To generate this message, Docker took the following steps:
 1. The Docker client contacted the Docker daemon.
 2. The Docker daemon pulled the "hello-world" image from the Docker Hub.
    (amd64)
 3. The Docker daemon created a new container from that image which runs the
    executable that produces the output you are currently reading.
 4. The Docker daemon streamed that output to the Docker client, which sent it
    to your terminal.

To try something more ambitious, you can run an Ubuntu container with:
 $ docker run -it ubuntu bash

Share images, automate workflows, and more with a free Docker ID:
 https://hub.docker.com/

For more examples and ideas, visit:
 https://docs.docker.com/get-started/

看到这个提示信息,说明 Docker 服务已经在虚拟机中正常运行了。

3. 通过 docker-install 脚本安装 Docker

官方提供了一个便捷的脚本来一键安装 Docker,可以通过如下命令下载该脚本:

[root@localhost ~]# curl -fsSL https://get.docker.com -o get-docker.sh

其中,-f/--fail 表示连接失败时不显示 HTTP 错误,-s/--silent 表示静默模式,不输出任何内容,-S/--show-error 表示显示错误,-L/--location 表示跟随重定向,-o/--output 表示将输出写入到某个文件中。

下载完成后,执行该脚本会自动安装 Docker:

[root@localhost ~]# sh ./get-docker.sh

如果想知道这个脚本具体做了什么,可以在执行命令之前加上 DRY_RUN=1 选项:

[root@localhost ~]# DRY_RUN=1 sh ./get-docker.sh
# Executing docker install script, commit: 93d2499759296ac1f9c510605fef85052a2c32be
yum install -y -q yum-utils
yum-config-manager --add-repo https://download.docker.com/linux/centos/docker-ce.repo
yum makecache
yum install -y -q docker-ce
yum install -y -q docker-ce-rootless-extras

可以看出和上一节手工安装的步骤基本类似,安装完成后,启动 Docker 服务并运行 hello-world 验证:

[root@localhost ~]# systemctl start docker
[root@localhost ~]# docker run hello-world

4. 离线安装 Docker

上面两种安装方式都需要连接外网,当我们的机器位于离线环境时(air-gapped systems),我们需要提前将 Docker 的安装包下载准备好。

我们从 https://download.docker.com/linux/ 这里找到对应的 Linux 发行版本和系统架构,比如我这里的系统是 CentOS 7.9,系统架构是 x84_64,所以就进入 /linux/centos/7/x86_64/stable/Packages/ 这个目录。但是这个目录里有很多的文件,我们该下载哪个文件呢?

为了确定要下载的文件和版本,我们进入刚刚安装的那个虚拟机中,通过 yum list installed | grep docker 看看自动安装时都安装了哪些包:

[root@localhost ~]# yum list installed | grep docker
containerd.io.x86_64                 1.4.12-3.1.el7                 @docker-ce-stable
docker-ce.x86_64                     3:20.10.12-3.el7               @docker-ce-stable
docker-ce-cli.x86_64                 1:20.10.12-3.el7               @docker-ce-stable
docker-ce-rootless-extras.x86_64     20.10.12-3.el7                 @docker-ce-stable
docker-scan-plugin.x86_64            0.12.0-3.el7                   @docker-ce-stable

我们将这些包都下载下来复制到一台新的虚拟机中,将网络服务关闭:

[root@localhost ~]# service network stop

然后执行 yum install 命令安装这些 RPM 包:

[root@localhost ~]# yum install *.rpm

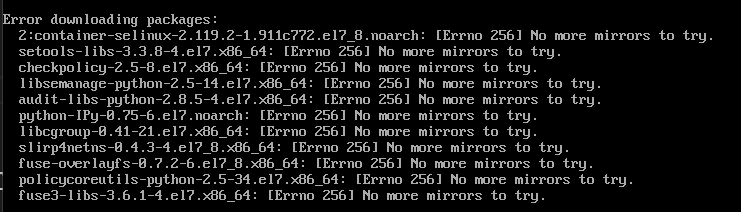
我们会发现 yum 在安装的时候会自动解析依赖,还是会从外网下载,会出现一堆的报错:

rpm-install-docker.png

我们可以对照着这个列表再去一个个的下载对应的包,全部依赖安装完毕后,再安装 Docker 即可。

当然这样一个个去试并不是什么好方法,我们可以使用 rpm-q 功能,查询 RPM 包的信息,-R 表示查询 RPM 包的依赖:

[root@localhost docker]# rpm -q -R -p docker-ce-20.10.12-3.el7.x86_64.rpm 
警告:docker-ce-20.10.12-3.el7.x86_64.rpm: 头V4 RSA/SHA512 Signature, 密钥 ID 621e9f35: NOKEY
/bin/sh
/bin/sh
/bin/sh
/usr/sbin/groupadd
container-selinux >= 2:2.74
containerd.io >= 1.4.1
docker-ce-cli
docker-ce-rootless-extras
iptables
libc.so.6()(64bit)
libc.so.6(GLIBC_2.2.5)(64bit)
libc.so.6(GLIBC_2.3)(64bit)
libcgroup
libdevmapper.so.1.02()(64bit)
libdevmapper.so.1.02(Base)(64bit)
libdevmapper.so.1.02(DM_1_02_97)(64bit)
libdl.so.2()(64bit)
libdl.so.2(GLIBC_2.2.5)(64bit)
libpthread.so.0()(64bit)
libpthread.so.0(GLIBC_2.2.5)(64bit)
libpthread.so.0(GLIBC_2.3.2)(64bit)
libseccomp >= 2.3
libsystemd.so.0()(64bit)
libsystemd.so.0(LIBSYSTEMD_209)(64bit)
rpmlib(CompressedFileNames) <= 3.0.4-1
rpmlib(FileDigests) <= 4.6.0-1
rpmlib(PayloadFilesHavePrefix) <= 4.0-1
rtld(GNU_HASH)
systemd
tar
xz
rpmlib(PayloadIsXz) <= 5.2-1

但是这样一个个去下载依赖的包也是很繁琐的,有没有什么办法能将依赖的包一次性都下载下来呢?当然有!还记得上面的 yum install 安装命令吧,其实 yum 在安装之前,先是做了两件事情,第一步解析包的依赖,然后将所有依赖的包下载下来,最后才是安装。而 yum --downloadonly 可以让我们只将依赖包下载下来,默认情况下 yum 将依赖的包下载到 /var/cache/yum/x86_64/[centos/fedora-version]/[repository]/packages 目录,其中 [repository] 表示来源仓库的名称,比如 base、docker-ce-stable、extras 等,不过这样还是不够友好,我们希望下载下来的文件放在一起,这时可以使用 --downloaddir 参数来指定下载目录:

[root@localhost ~]# yum --downloadonly --downloaddir=. install docker-ce docker-ce-cli containerd.io
已加载插件:fastestmirror
Loading mirror speeds from cached hostfile
 * base: mirrors.bupt.edu.cn
 * extras: mirrors.dgut.edu.cn
 * updates: mirrors.bupt.edu.cn
正在解决依赖关系
--> 正在检查事务
---> 软件包 containerd.io.x86_64.0.1.4.12-3.1.el7 将被 安装
--> 正在处理依赖关系 container-selinux >= 2:2.74,它被软件包 containerd.io-1.4.12-3.1.el7.x86_64 需要
---> 软件包 docker-ce.x86_64.3.20.10.12-3.el7 将被 安装
--> 正在处理依赖关系 docker-ce-rootless-extras,它被软件包 3:docker-ce-20.10.12-3.el7.x86_64 需要
--> 正在处理依赖关系 libcgroup,它被软件包 3:docker-ce-20.10.12-3.el7.x86_64 需要
---> 软件包 docker-ce-cli.x86_64.1.20.10.12-3.el7 将被 安装
--> 正在处理依赖关系 docker-scan-plugin(x86-64),它被软件包 1:docker-ce-cli-20.10.12-3.el7.x86_64 需要
--> 正在检查事务
---> 软件包 container-selinux.noarch.2.2.119.2-1.911c772.el7_8 将被 安装
--> 正在处理依赖关系 policycoreutils-python,它被软件包 2:container-selinux-2.119.2-1.911c772.el7_8.noarch 需要
---> 软件包 docker-ce-rootless-extras.x86_64.0.20.10.12-3.el7 将被 安装
--> 正在处理依赖关系 fuse-overlayfs >= 0.7,它被软件包 docker-ce-rootless-extras-20.10.12-3.el7.x86_64 需要
--> 正在处理依赖关系 slirp4netns >= 0.4,它被软件包 docker-ce-rootless-extras-20.10.12-3.el7.x86_64 需要
---> 软件包 docker-scan-plugin.x86_64.0.0.12.0-3.el7 将被 安装
---> 软件包 libcgroup.x86_64.0.0.41-21.el7 将被 安装
--> 正在检查事务
---> 软件包 fuse-overlayfs.x86_64.0.0.7.2-6.el7_8 将被 安装
--> 正在处理依赖关系 libfuse3.so.3(FUSE_3.2)(64bit),它被软件包 fuse-overlayfs-0.7.2-6.el7_8.x86_64 需要
--> 正在处理依赖关系 libfuse3.so.3(FUSE_3.0)(64bit),它被软件包 fuse-overlayfs-0.7.2-6.el7_8.x86_64 需要
--> 正在处理依赖关系 libfuse3.so.3()(64bit),它被软件包 fuse-overlayfs-0.7.2-6.el7_8.x86_64 需要
---> 软件包 policycoreutils-python.x86_64.0.2.5-34.el7 将被 安装
--> 正在处理依赖关系 setools-libs >= 3.3.8-4,它被软件包 policycoreutils-python-2.5-34.el7.x86_64 需要
--> 正在处理依赖关系 libsemanage-python >= 2.5-14,它被软件包 policycoreutils-python-2.5-34.el7.x86_64 需要
--> 正在处理依赖关系 audit-libs-python >= 2.1.3-4,它被软件包 policycoreutils-python-2.5-34.el7.x86_64 需要
--> 正在处理依赖关系 python-IPy,它被软件包 policycoreutils-python-2.5-34.el7.x86_64 需要
--> 正在处理依赖关系 libqpol.so.1(VERS_1.4)(64bit),它被软件包 policycoreutils-python-2.5-34.el7.x86_64 需要
--> 正在处理依赖关系 libqpol.so.1(VERS_1.2)(64bit),它被软件包 policycoreutils-python-2.5-34.el7.x86_64 需要
--> 正在处理依赖关系 libapol.so.4(VERS_4.0)(64bit),它被软件包 policycoreutils-python-2.5-34.el7.x86_64 需要
--> 正在处理依赖关系 checkpolicy,它被软件包 policycoreutils-python-2.5-34.el7.x86_64 需要
--> 正在处理依赖关系 libqpol.so.1()(64bit),它被软件包 policycoreutils-python-2.5-34.el7.x86_64 需要
--> 正在处理依赖关系 libapol.so.4()(64bit),它被软件包 policycoreutils-python-2.5-34.el7.x86_64 需要
---> 软件包 slirp4netns.x86_64.0.0.4.3-4.el7_8 将被 安装
--> 正在检查事务
---> 软件包 audit-libs-python.x86_64.0.2.8.5-4.el7 将被 安装
---> 软件包 checkpolicy.x86_64.0.2.5-8.el7 将被 安装
---> 软件包 fuse3-libs.x86_64.0.3.6.1-4.el7 将被 安装
---> 软件包 libsemanage-python.x86_64.0.2.5-14.el7 将被 安装
---> 软件包 python-IPy.noarch.0.0.75-6.el7 将被 安装
---> 软件包 setools-libs.x86_64.0.3.3.8-4.el7 将被 安装
--> 解决依赖关系完成

依赖关系解决

========================================================================================================================================================
 Package                                    架构                    版本                                        源                                 大小
========================================================================================================================================================
正在安装:
 containerd.io                              x86_64                  1.4.12-3.1.el7                              docker-ce-stable                   28 M
 docker-ce                                  x86_64                  3:20.10.12-3.el7                            docker-ce-stable                   23 M
 docker-ce-cli                              x86_64                  1:20.10.12-3.el7                            docker-ce-stable                   30 M
为依赖而安装:
 audit-libs-python                          x86_64                  2.8.5-4.el7                                 base                               76 k
 checkpolicy                                x86_64                  2.5-8.el7                                   base                              295 k
 container-selinux                          noarch                  2:2.119.2-1.911c772.el7_8                   extras                             40 k
 docker-ce-rootless-extras                  x86_64                  20.10.12-3.el7                              docker-ce-stable                  8.0 M
 docker-scan-plugin                         x86_64                  0.12.0-3.el7                                docker-ce-stable                  3.7 M
 fuse-overlayfs                             x86_64                  0.7.2-6.el7_8                               extras                             54 k
 fuse3-libs                                 x86_64                  3.6.1-4.el7                                 extras                             82 k
 libcgroup                                  x86_64                  0.41-21.el7                                 base                               66 k
 libsemanage-python                         x86_64                  2.5-14.el7                                  base                              113 k
 policycoreutils-python                     x86_64                  2.5-34.el7                                  base                              457 k
 python-IPy                                 noarch                  0.75-6.el7                                  base                               32 k
 setools-libs                               x86_64                  3.3.8-4.el7                                 base                              620 k
 slirp4netns                                x86_64                  0.4.3-4.el7_8                               extras                             81 k

事务概要
========================================================================================================================================================
安装  3 软件包 (+13 依赖软件包)

总下载量:95 M
安装大小:387 M
Background downloading packages, then exiting:
exiting because "Download Only" specified

可以看到 3 个软件包和 13 个依赖包都下载好了,我们将这 16 个包全部复制到离线机器上,运行 yum install *.rpm 即可。

除了 yum --downloadonly 实现离线安装之外,还有很多其他的方式,比如:搭建自己的本地 yum 源就是一种更通用的解决方案,可以根据参考链接尝试一下。

参考

  1. Install Docker Engine on CentOS
  2. curl - How To Use
  3. Centos7通过reposync搭建本地Yum源

记一个 Docker 镜像无法运行的坑

最近在工作中遇到了一个 Docker 镜像无法运行的问题,事后总结时发现其中有几个点挺有意思,值得记录下来以备后用,也可以避免其他人踩坑。

一、运行镜像报错

我的开发环境是 Windows,使用 Docker Desktop 作为本地 Docker 环境。最近在一个项目中需要把 war 包打成 Docker 镜像并推送到仓库里去,却发现打好的这个镜像运行不起来,运行时报下面这样的错:

# docker run --rm -it manager
standard_init_linux.go:207: exec user process caused "no such file or directory"

检查 Dockerfile 文件,是非常简单的:

FROM openjdk:8-jre-alpine

ADD entrypoint.sh entrypoint.sh
ADD *.war app.war

EXPOSE 8088

RUN chmod 755 entrypoint.sh
ENTRYPOINT ["./entrypoint.sh"]

镜像是基于 openjdk 的基础镜像,将 entrypoint.sh*.war 拷贝到镜像中,并将 entrypoint.sh 作为默认的启动脚本文件。初看应该是没问题的,war 包在本地使用 java -jar 也可以跑起来。

二、检查镜像

那么这个镜像是怎么回事?看报错信息,应该是运行镜像时,找不到某个文件或目录,但是我的这个镜像一共就两个文件,一个 entrypoint.sh 一个 war 包,难道这两个文件没有 ADD 到镜像里?

于是试着运行命令 docker run --rm -it manager sh,想着进 shell 查看下文件,发现依然报错,难道镜像里没有 sh 脚本?试着连换了几个命令:docker run --rm -it manager /bin/bashdocker run --rm -it manager ls 发现都是这个错,这怎么可能呢,连 ls 都没有?

无奈 Google 之,才发现原来如果镜像配置了 entrypoint,要使用下面这样的方式来检查镜像:

# docker run --rm -it --entrypoint sh manager

进到容器里来了之后,使用 ls 可以看到文件都在,没毛病:

/ # ls
app.war        entrypoint.sh  lib            opt            run            sys            var
bin            etc            media          proc           sbin           tmp
dev            home           mnt            root           srv            usr

使用 java -jar app.war 可以正常运行,但是奇怪的是,./entrypoint.sh 脚本却运行不了:

/ # ./entrypoint.sh
sh: ./entrypoint.sh: not found

这个脚本文件明明就在这,却报错 not found,这让我一度怀疑人生,遇到灵异事件了。

三、换行惹的祸

不得已只能继续 Google 之,发现网络上跟我一样的人还有很多,脚本无法运行最可能的原因是 Sha-Bang 写的有问题,所谓 Sha-Bang 就是 #!,通常会写在 shell 文件第一行,用于指定命令行解释器。类似于下面这样:

/ # cat entrypoint.sh
#!/bin/sh
blabla

使用 ls /bin/sh 发现 /bin/sh 文件也在,应该没问题啊。苦思冥想之际,突然脑海中闪过一个想法,难道这里有隐藏字符?一般遇到这种灵异事件的时候,都很可能和隐藏字符有关。使用 cat -v 查看文件,果然发现这里的 /bin/sh 后面多了个 ^M

/ # cat -v entrypoint.sh
#!/bin/sh^M
blabla

顿时豁然开朗,这不就是 Windows 下的换行符吗?一切都是换行符惹的祸。

使用 dos2unix 将 entrypoint.sh 文件中的 Windows 格式的换行符转为 UNIX 格式,再一次使用 docker build,这次终于运行成功了。

四、最坑的 Git 配置

到这里本来已经结束了,不过后来又发生了一件小事,让我又发现另一个坑,才找到了这个问题最根本的原因。当我解决了这个问题之后,就去给同事分享,可是听了我的分享之后,同事却一脸懵逼的表示自己从来都没遇到过这个问题,并且在他电脑上给我演示了一遍 docker builddocker run,一切正常,并没有报错,同样的一份代码,为什么在我的电脑上 build 就有问题?看着同事对我露出的迷之微笑,我又一次陷入了困惑。

我让他把 entrypoint.sh 发给我,看了下,他的换行符格式竟然是 UNIX 的,可是我本地代码换行符明明是 Windows 的,使用 git status 也可以看到 nothing to commit, working tree clean,表明本地代码和仓库代码是一样的,为什么换行符却不一样呢?

查看 Git 的配置文件,和他的对比了一下,发现一个很可能的疑点:

[core]
    autocrlf = true

查询官网文档,终于找到了原因,原来 Git 在 pull 代码的时候可能会偷偷的对你的代码做手脚。如果你配置了 autocrlf = true,那么当你签出代码时,Git 会自动的把 LF 转换成 CRLF,然后当你 push 的时候,又自动的将 CRLF 转换成 LF。这看上去很贴心的功能,实际上却有着很大的漏洞,譬如像我这样,直接在本地打镜像,或者需要直接将 shell 文件上传到 Linux 服务器上运行的,都可能会出问题。关键这个配置在 Windows 下默认是打开的,所以建议把这个配置关掉:

$ git config --global core.autocrlf false

坑之总结

  • 坑一:镜像如果配置了 entrypointdocker run 的时候应该加上 --entrypoint 参数来检查镜像
  • 坑二:脚本运行时报 not found,最可能的原因是 Sha-Bang 写的有问题,检查脚本文件中是否存在隐藏字符,譬如 Windows 的换行符,这里不得不吐槽下,这个 not found 提示真的让人迷惑,提示里能不能把隐藏字符也带上?
  • 坑三:建议关闭 Git 的 autocrlf 配置

参考

  1. How to see docker image contents
  2. Standard_init_linux.go:175 exec user process caused no such file
  3. GitHub 第一坑:换行符自动转换
  4. 自定义 Git - 配置 Git

博客升级小记

由于几年前一直在做 .Net 相关的开发,于是在阿里云上买了一台 Windows Server 的主机,在上面用 IIS 搭建 Web 环境还是比较方便的。后来写 PHP,也是用的 Windows 环境,那个时候比较流行 SAE 搭建本地开发环境,非常简单,还写过一篇文章介绍了 在 Windows 上搭建 PHP 本地开发环境 的其他方法,基本上都是部署在这台服务器上。这台服务器一用就是好多年,所以后来开始写博客,无论是一开始用的 WordPress 还是现在用的 Typecho,也是一直放在这台服务器上的。但随着自己开始学 Java,学 Docker,学 DevOps,这台 Windows Server 越来越没用了,一年将近 1000 块的大洋,性价比超低。

最近这台服务器要到期了,一直想着换台 Linux 的服务器,终于可以如愿了。不过迁移服务器好麻烦,好多东西要备份,花了大半天时间把服务器上的东西备份好,又花了大半天的时间把博客迁移到新的服务器,这里对迁移过程做个记录,便于来日查阅。

一、备份博客

备份分两步,备份 MySQL 和备份 Typecho:

1.1 备份 MySQL

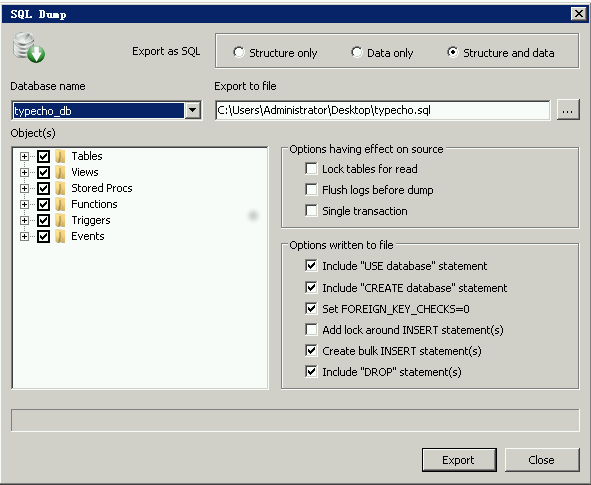
我这里直接使用 MySQL 的图形化客户端工具 SQLyog Ultimate,Backup/Export -> Backup Database As SQL Dump,选择 Structure and data,导出即可。

dump-as-sql.png

当然也可以用 mysqldump,譬如下面这样:

> mysqldump -u root -p --databases typecho_db > typecho_db.sql

1.2 备份 Typecho

这个没啥说的,直接将网站目录打包备份即可。值得注意的是 Typecho 的目录结构,它的根目录有几个文件:index.php 是入口文件,install.php 是安装文件,建议在安装完成后删除,config.inc.php 这个是 Typecho 的配置文件,在安装时自动生成的。除此之外,还有三个目录:admin 是管理后台的代码,var 是 Typecho 核心代码,usr 用于存放用户内容,譬如用户的主题位于 usr/themes,插件位于 usr/plugins,用户上传的文件位于 usr/uploads

二、安装 MySQL

自从有了 Docker,Linux 下的很多软件安装起来都变得非常轻松。比如安装 MySQL,可以用下面的一行命令就可以搞定:

sudo docker run -d -p 3306:3306 -e MYSQL_ROOT_PASSWORD=password mysql:5.7

安装完成后,我们需要把刚刚备份的数据库导入到这个新数据库:

$ mysql -h 127.0.0.1 -uroot -p < typecho.sql

实际上还有更简单的一种方法,使用 Docker 运行 MySQL 时,可以在 /docker-entrypoint-initdb.d 目录下放一些初始化的脚本,可以是 shell,也可以是 sql,我们把刚刚备份的 typecho.sql 挂载到这个目录:

$ sudo docker run -d --name typecho-db -p 3306:3306 \
 -e MYSQL_ROOT_PASSWORD=password \
 -v ~/blog/mysql/init:/docker-entrypoint-initdb.d \
 mysql:5.7

三、搭建 Nginx + PHP-FPM

接下来我们搭建 Web 服务器,这包括两个部分:Nginx 和 PHP。

3.1 安装 PHP-FPM

首先我们安装 PHP,官方提供了几种不同类型的镜像,根据 tag 的名称来进行区分,比如:php-<version>-cliphp-<version>-apachephp-<version>-fpm 等,如果你使用的 Web 服务器是 Apache,可以直接使用 php-apache,这里由于我使用的是 Nginx,所以选择安装 php-fpm

sudo docker run -d --name typecho-php -p 9000:9000 \
  -v ~/blog/websites:/var/www/html \
  php:7.2-fpm

FPM 是 PHP 的 FastCGI 进程管理器,一般来说,以 CGI 的方式来运行 PHP 有几种比较常见的方式,比如:CGI、FastCGI、PHP-FPM,关于这几个的区别,可以参考 这里。PHP-FPM 默认监听 9000 端口,接受 Nginx 转发过来的 CGI 请求,下面我们就来配置 Nginx。

这里挂载了 /var/www/html 目录,是为了 PHP 程序找到要执行的脚本文件,下面的 Nginx 镜像也会挂载这个目录,但是目的是完全不一样的。

3.2 安装 Nginx

Nginx 使用下面的 Docker 命令安装:

sudo docker run -d --name typecho-nginx -p 80:80 -p 443:443 \
  -v ~/blog/nginx/conf:/etc/nginx/conf.d \
  -v ~/blog/websites:/var/www/html \
  nginx

Nginx 默认的配置文件里有几行被注释掉的代码,是配置 PHP FastCGI 的一个简单例子,如下:

    # pass the PHP scripts to FastCGI server listening on 127.0.0.1:9000
    #
    #location ~ \.php$ {
    #    root           html;
    #    fastcgi_pass   127.0.0.1:9000;
    #    fastcgi_index  index.php;
    #    fastcgi_param  SCRIPT_FILENAME  /scripts$fastcgi_script_name;
    #    include        fastcgi_params;
    #}

但是拿这个例子直接跑 Typecho 会报 File Not Found 错误,根据 Typecho 的 官方文档 服务器环境设置,我们还需要加上 SCRIPT_NAMEPATH_INFO 这两个 FastCGI 参数。另外,如果你的博客开启了伪静态,还要加一条 rewrite 规则对所有的请求进行转发。下面是完整的配置:

server {
    listen 80;
    server_name www.aneasystone.com;

    root /var/www/html;

    location / {
        index index.php index.html index.htm;
    }
    
    if (!-e $request_filename) {
        rewrite ^(.*)$ /index.php$1 last;
    }

    location ~ \.php(\/.*)*$ {
        fastcgi_pass   172.17.0.1:9000;
        set $path_info "";
        set $real_script_name $fastcgi_script_name;
        if ($fastcgi_script_name ~ "^(.+?\.php)(/.+)$") {
            set $real_script_name $1;
            set $path_info $2;
        }
        fastcgi_param SCRIPT_FILENAME $document_root$real_script_name;
        fastcgi_param SCRIPT_NAME $real_script_name;
        fastcgi_param PATH_INFO $path_info;
        fastcgi_index  index.php;
        include        fastcgi_params;
    }
}

正如上文所述,Nginx 镜像和 PHP 镜像在运行时,都挂载了 /var/www/html 目录。这其实是为了支持 Typecho 的伪静态配置,我们通过 !-e $request_filename 来判断要访问的文件是否存在,如果不存在则 rewrite 到 index.php,如果我们不挂载 /var/www/html 这个目录,则所有访问的路径都会不存在,直接触发重写规则,这样会导致 Typecho 的管理后台打不开。

3.3 遭遇 Database Server Error

Web 服务器搭建好了后,访问博客首页,发现报 500 错误,页面上直接显示大大的 “Database Server Error” 提示信息。我们打开 Typecho 的调试模式,在 config.inc.php 文件顶部加上一行代码:

define('__TYPECHO_DEBUG__', TRUE);

重新刷新页面,可以看到下面的错误详情:

Adapter Typecho_Db_Adapter_Mysql is not available

Typecho_Db_Exception: Adapter Typecho_Db_Adapter_Mysql is not available in /var/www/html/var/Typecho/Db.php:123
Stack trace:
#0 /var/www/html/config.inc.php(57): Typecho_Db->__construct('Typecho_Db_Adap...', 'typecho_')
#1 /var/www/html/index.php(11): include_once('/var/www/html/c...')
#2 {main}

发现是找不到数据库适配器 Mysql,Google 之后发现 PHP 7 以后的版本已经去除了 Mysql 扩展,推荐使用 PDO,我们修改 config.inc.php 文件中定义 Typecho_Db 的地方,将 Mysql 改为 Pdo_Mysql

$db = new Typecho_Db('Pdo_Mysql', 'typecho_');

重新刷新页面,发现错误还是没变:

Adapter Typecho_Db_Adapter_Pdo_Mysql is not available

使用 phpinfo() 查看 PHP 信息,发现只有 sqlite 这个 PDO driver:

pdo.jpg

才知道这是因为官方的 PHP 镜像里默认情况下并没有安装 pdo_mysql 这个扩展,可以使用 docker-php-ext-install 来安装,安装好后,要重启 PHP 重新加载扩展:

aneasystone@little-stone:~/blog/websites$ sudo docker exec -it typecho-php bash
root@42633b997f8b:/var/www/html# docker-php-ext-install pdo pdo_mysql
aneasystone@little-stone:~/blog/websites$ sudo docker restart typecho-php

四、升级 Typecho

至此,博客已经基本上完成了迁移,接着又把 Typecho 的版本升级了下。Typecho 1.1 正式版发布有 1 年多了,但我的版本还是 1.0,一直怕麻烦懒得升级,看着控制台的有新版本的提醒,都已经习惯性的无视了。这次趁着博客迁移,顺便升级下,才发现升级简单的很。

首先从 Typecho 的下载页面 下载 Typecho 1.1 正式版,然后按照 官方的升级步骤 先备份 /admin/、/var/、/index.php、/install.php 这几个文件,要注意 /usr/ 目录不用动,正如上面提到的,这个目录下保存着用户自己的一些文件,包括主题,插件和上传的文件。然后解压下载的最新版本,将相应的几个文件和目录拷贝到 websites 目录。

这时 Typecho 的前台页面还可以照常访问,没有任何变化。不过访问管理后台时,可以看到检测到新版本的提醒:

typecho-upgrade.jpg

我们点击 “完成升级” 按钮就升级成功了。可以看出 Typecho 的升级和插件、主题的安装一样,都还是手工操作的方式,如果能做一个管理的功能,那多好啊。

五、支持 HTTPS

HTTPS 早就已经是主流,譬如百度早在 2014 年就已经主持全站 HTTPS,而且谷歌的 Chrome 浏览器从 Version 68 开始,将对所有 HTTP 网站显示 “不安全” 的警告,所以用最新版的浏览器访问我的博客,左上角都能看到 “不安全” 的字样,这让人很不舒服,于是决定也投入到 HTTPS 的怀抱中来。

关于 HTTPS 相关的概念,我之前有一篇博客《HTTPS 和 证书》做了详细的介绍,感兴趣的同学可以参考。要想让你的网站支持 HTTPS,你必须得有 SSL 安全证书,理论上我们自己也可以给自己签发证书,但是自己签发的证书,一般的浏览器都不会信任,所以我们要找证书授权中心,也就是所谓的 CA 来签发证书。在以前,签发 SSL 安全证书都是由一些比较大型的 CA 机构,比如 GeoTrust、GlobalSign 等来提供服务,而通常证书签发服务价格都比较昂贵,不过从 2015 年开始,情况有所改观,在这一年,EEF 电子前哨基金会、 Mozilla 基金会和美国密歇根大学成立了一个公益组织叫 ISRG (Internet Security Research Group),他们推出了 Let’s Encrypt 免费证书。

根据你是否有访问 Web 服务器上 Shell 的权限,有两种方式来获取 Let’s Encrypt 证书,一种是使用官方推出的 ACME 客户端 Certbot,它可以通过 ACME 协议 自动从 Let’s Encrypt CA 获取证书,另一种是使用主机供应商提供的服务,或者使用 Certbot 的手工模式生成证书,再上传到服务器上。很显然,第一种方式是最简单的。

访问 Certbot 的首页,选择你使用的软件(Apache、Nginx、Haproxy 等)以及你使用的操作系统,Certbot 暂时只支持 UNIX-like 类的操作系统,不支持 Windows,所以如果你的 Web 服务器是 Windows Server,可能要使用 其他的 ACME 客户端,比如 acme.sh 脚本 就支持 Windows(cygwin)。我这里选择 Nginx + Ubuntu 14.04 (trusty):

certbot.jpg

下面会显示相应的操作步骤:

$ sudo certbot --nginx

这个命令使用了 Certbot 的 nginx 插件,它会自动获取证书,并且会自动修改你的 Nginx 配置文件,将证书自动设置好。当然,如果你不想让 Certbot 修改你的 Nginx 配置文件,可以加上 certonly 参数(官方将其称为 子命令):

$ sudo certbot --nginx certonly

其实,这个命令也会修改你的 Nginx 配置文件,它的执行流程如下:

  1. 临时修改 Nginx 配置,添加一个新的 server 块,用于处理 ACME Challenge(详见 ACME 协议
  2. 重新启动 Nginx
  3. 回滚相应的配置改动
  4. 再次重新启动 Nginx

如果你对这个流程还是不放心,不想让 Certbot 动你的 Nginx,或者像我这里遇到的场景一样,Nginx 运行在 Docker 容器里,而 Certbot 运行在宿主机里,Certbot 没法自动重启 Nginx,那么可以选择使用 webroot 插件

$ sudo certbot certonly --webroot -w /var/www/html -d  www.aneasystone.com

这个命令会在 Web 根目录创建一个 /.well-known/acme-challenge 文件,Let’s Encrypt 通过域名来请求这个文件,以此来验证你对该域名所对应的主机是否拥有权限。如果一切顺利,根据屏幕上的提示操作即可,最终看到下面这样的提示就说明证书获取成功了。

IMPORTANT NOTES:
 - Congratulations! Your certificate and chain have been saved at:
   /etc/letsencrypt/live/www.aneasystone.com/fullchain.pem
   Your key file has been saved at:
   /etc/letsencrypt/live/www.aneasystone.com/privkey.pem
   Your cert will expire on 2019-04-04. To obtain a new or tweaked
   version of this certificate in the future, simply run certbot-auto
   again. To non-interactively renew *all* of your certificates, run
   "certbot-auto renew"
 - Your account credentials have been saved in your Certbot
   configuration directory at /etc/letsencrypt. You should make a
   secure backup of this folder now. This configuration directory will
   also contain certificates and private keys obtained by Certbot so
   making regular backups of this folder is ideal.
 - If you like Certbot, please consider supporting our work by:

   Donating to ISRG / Let's Encrypt:   https://letsencrypt.org/donate
   Donating to EFF:                    https://eff.org/donate-le

最终生成的 SSL 证书位于 /etc/letsencrypt/live/www.aneasystone.com/ 目录,我们修改 Nginx 的启动命令,将该目录挂载到 Docker 容器里:

sudo docker run -d --name typecho-nginx -p 80:80 -p 443:443 \
  -v ~/blog/nginx/conf:/etc/nginx/conf.d \
  -v /etc/letsencrypt:/etc/letsencrypt \
  -v ~/blog/websites:/var/www/html \
  nginx

然后修改 Nginx 的配置文件,将之前的 listen 80 改为 listen 443 ssl,再手动加上证书的配置:

    listen 443 ssl;

    ssl_certificate      /etc/letsencrypt/live/www.aneasystone.com/fullchain.pem;
    ssl_certificate_key  /etc/letsencrypt/live/www.aneasystone.com/privkey.pem;

最后,将 listen 80 放在一个新的 server 块,直接将 http 的请求重定向到 https 地址:

server {
    listen 80;
    server_name www.aneasystone.com;
    return 301 https://$server_name$request_uri;
}

至此,访问博客首页,发现自动跳转到 https://www.aneasystone.com 了。正在兴奋之余,还以为大功告成,却突然发现,博客上的菜单按钮点不动,F12 查看了下,才发现很多 js 和 css 报错,这是由于这些静态资源引用的是 HTTP 地址,在 HTTPS 站点引用 HTTP 资源,浏览器会直接 BLOCK 掉,所以还需要去插件和主题目录去修改所有用到的 HTTP 链接,改成 HTTPS 即可。

折腾到这里,是时候收工了。

不过对于 Certbot,还有很多东西可以学习,譬如它还支持其他的一些插件:apache、nginx、standalone、manual、webroot 等,如果你要申请泛域名证书(a wildcard certificate),还要使用 DNS 插件。下面是 Certbot 支持的插件列表:

certbot-plugins.jpg

另外,如果对 Certbot 的原理感兴趣,还可以了解下 ACME 协议

参考

  1. Typecho Official Site
  2. mysql - Docker Hub
  3. php - Docker Hub
  4. nginx - Docker Hub
  5. Docker Hub MySQL官方镜像实现首次启动后初始化库表 | Ember
  6. 服务器环境设置 - Typecho Docs
  7. Typecho博客升级导致Database Server Error - 平凡之路 -- Lester You's Blog
  8. HTTPS 简介及使用官方工具 Certbot 配置 Let’s Encrypt SSL 安全证书详细教程
  9. User Guide — Certbot 0.29.0.dev0 documentation

实战 Prometheus 搭建监控系统

Prometheus 是一款基于时序数据库的开源监控告警系统,说起 Prometheus 则不得不提 SoundCloud,这是一个在线音乐分享的平台,类似于做视频分享的 YouTube,由于他们在微服务架构的道路上越走越远,出现了成百上千的服务,使用传统的监控系统 StatsD 和 Graphite 存在大量的局限性,于是他们在 2012 年开始着手开发一套全新的监控系统。Prometheus 的原作者是 Matt T. Proud,他也是在 2012 年加入 SoundCloud 的,实际上,在加入 SoundCloud 之前,Matt 一直就职于 Google,他从 Google 的集群管理器 Borg 和它的监控系统 Borgmon 中获取灵感,开发了开源的监控系统 Prometheus,和 Google 的很多项目一样,使用的编程语言是 Go。

很显然,Prometheus 作为一个微服务架构监控系统的解决方案,它和容器也脱不开关系。早在 2006 年 8 月 9 日,Eric Schmidt 在搜索引擎大会上首次提出了云计算(Cloud Computing)的概念,在之后的十几年里,云计算的发展势如破竹。在 2013 年,Pivotal 的 Matt Stine 又提出了云原生(Cloud Native)的概念,云原生由微服务架构、DevOps 和以容器为代表的敏捷基础架构组成,帮助企业快速、持续、可靠、规模化地交付软件。为了统一云计算接口和相关标准,2015 年 7 月,隶属于 Linux 基金会的 云原生计算基金会(CNCF,Cloud Native Computing Foundation) 应运而生。第一个加入 CNCF 的项目是 Google 的 Kubernetes,而 Prometheus 是第二个加入的(2016 年)。

目前 Prometheus 已经广泛用于 Kubernetes 集群的监控系统中,对 Prometheus 的历史感兴趣的同学可以看看 SoundCloud 的工程师 Tobias Schmidt 在 2016 年的 PromCon 大会上的演讲:The History of Prometheus at SoundCloud

一、Prometheus 概述

我们在 SoundCloud 的官方博客中可以找到一篇关于他们为什么需要新开发一个监控系统的文章 Prometheus: Monitoring at SoundCloud,在这篇文章中,他们介绍到,他们需要的监控系统必须满足下面四个特性:

  • A multi-dimensional data model, so that data can be sliced and diced at will, along dimensions like instance, service, endpoint, and method.
  • Operational simplicity, so that you can spin up a monitoring server where and when you want, even on your local workstation, without setting up a distributed storage backend or reconfiguring the world.
  • Scalable data collection and decentralized architecture, so that you can reliably monitor the many instances of your services, and independent teams can set up independent monitoring servers.
  • Finally, a powerful query language that leverages the data model for meaningful alerting (including easy silencing) and graphing (for dashboards and for ad-hoc exploration).

简单来说,就是下面四个特性:

  • 多维度数据模型
  • 方便的部署和维护
  • 灵活的数据采集
  • 强大的查询语言

实际上,多维度数据模型和强大的查询语言这两个特性,正是时序数据库所要求的,所以 Prometheus 不仅仅是一个监控系统,同时也是一个时序数据库。那为什么 Prometheus 不直接使用现有的时序数据库作为后端存储呢?这是因为 SoundCloud 不仅希望他们的监控系统有着时序数据库的特点,而且还需要部署和维护非常方便。纵观比较流行的时序数据库(参见下面的附录),他们要么组件太多,要么外部依赖繁重,比如:Druid 有 Historical、MiddleManager、Broker、Coordinator、Overlord、Router 一堆的组件,而且还依赖于 ZooKeeper、Deep storage(HDFS 或 S3 等),Metadata store(PostgreSQL 或 MySQL),部署和维护起来成本非常高。而 Prometheus 采用去中心化架构,可以独立部署,不依赖于外部的分布式存储,你可以在几分钟的时间里就可以搭建出一套监控系统。

此外,Prometheus 数据采集方式也非常灵活。要采集目标的监控数据,首先需要在目标处安装数据采集组件,这被称之为 Exporter,它会在目标处收集监控数据,并暴露出一个 HTTP 接口供 Prometheus 查询,Prometheus 通过 Pull 的方式来采集数据,这和传统的 Push 模式不同。不过 Prometheus 也提供了一种方式来支持 Push 模式,你可以将你的数据推送到 Push Gateway,Prometheus 通过 Pull 的方式从 Push Gateway 获取数据。目前的 Exporter 已经可以采集绝大多数的第三方数据,比如 Docker、HAProxy、StatsD、JMX 等等,官网有一份 Exporter 的列表

除了这四大特性,随着 Prometheus 的不断发展,开始支持越来越多的高级特性,比如:服务发现更丰富的图表展示使用外部存储强大的告警规则和多样的通知方式。下图是 Prometheus 的整体架构图(图片来源):

architecture.png

从上图可以看出,Prometheus 生态系统包含了几个关键的组件:Prometheus server、Pushgateway、Alertmanager、Web UI 等,但是大多数组件都不是必需的,其中最核心的组件当然是 Prometheus server,它负责收集和存储指标数据,支持表达式查询,和告警的生成。接下来我们就来安装 Prometheus server。

二、安装 Prometheus server

Prometheus 可以支持多种安装方式,包括 Docker、Ansible、Chef、Puppet、Saltstack 等。下面介绍最简单的两种方式,一种是直接使用编译好的可执行文件,开箱即用,另一种是使用 Docker 镜像,更多的安装方式可以参考 这里

2.1 开箱即用

首先从 官网的下载页面 获取 Prometheus 的最新版本和下载地址,目前最新版本是 2.4.3(2018年10月),执行下面的命令下载并解压:

$ wget https://github.com/prometheus/prometheus/releases/download/v2.4.3/prometheus-2.4.3.linux-amd64.tar.gz
$ tar xvfz prometheus-2.4.3.linux-amd64.tar.gz

然后切换到解压目录,检查 Prometheus 版本:

$ cd prometheus-2.4.3.linux-amd64
$ ./prometheus --version
prometheus, version 2.4.3 (branch: HEAD, revision: 167a4b4e73a8eca8df648d2d2043e21bdb9a7449)
  build user:       root@1e42b46043e9
  build date:       20181004-08:42:02
  go version:       go1.11.1

运行 Prometheus server:

$ ./prometheus --config.file=prometheus.yml

2.2 使用 Docker 镜像

使用 Docker 安装 Prometheus 更简单,运行下面的命令即可:

$ sudo docker run -d -p 9090:9090 prom/prometheus

一般情况下,我们还会指定配置文件的位置:

$ sudo docker run -d -p 9090:9090 \
    -v ~/docker/prometheus/:/etc/prometheus/ \
    prom/prometheus

我们把配置文件放在本地 ~/docker/prometheus/prometheus.yml,这样可以方便编辑和查看,通过 -v 参数将本地的配置文件挂载到 /etc/prometheus/ 位置,这是 prometheus 在容器中默认加载的配置文件位置。如果我们不确定默认的配置文件在哪,可以先执行上面的不带 -v 参数的命令,然后通过 docker inspect 命名看看容器在运行时默认的参数有哪些(下面的 Args 参数):

$ sudo docker inspect 0c
[...]
        "Id": "0c4c2d0eed938395bcecf1e8bb4b6b87091fc4e6385ce5b404b6bb7419010f46",
        "Created": "2018-10-15T22:27:34.56050369Z",
        "Path": "/bin/prometheus",
        "Args": [
            "--config.file=/etc/prometheus/prometheus.yml",
            "--storage.tsdb.path=/prometheus",
            "--web.console.libraries=/usr/share/prometheus/console_libraries",
            "--web.console.templates=/usr/share/prometheus/consoles"
        ],

[...]

2.3 配置 Prometheus

正如上面两节看到的,Prometheus 有一个配置文件,通过参数 --config.file 来指定,配置文件格式为 YAML。我们可以打开默认的配置文件 prometheus.yml 看下里面的内容:

/etc/prometheus $ cat prometheus.yml 
# my global config
global:
  scrape_interval:     15s # Set the scrape interval to every 15 seconds. Default is every 1 minute.
  evaluation_interval: 15s # Evaluate rules every 15 seconds. The default is every 1 minute.
  # scrape_timeout is set to the global default (10s).

# Alertmanager configuration
alerting:
  alertmanagers:
  - static_configs:
    - targets:
      # - alertmanager:9093

# Load rules once and periodically evaluate them according to the global 'evaluation_interval'.
rule_files:
  # - "first_rules.yml"
  # - "second_rules.yml"

# A scrape configuration containing exactly one endpoint to scrape:
# Here it's Prometheus itself.
scrape_configs:
  # The job name is added as a label `job=<job_name>` to any timeseries scraped from this config.
  - job_name: 'prometheus'

    # metrics_path defaults to '/metrics'
    # scheme defaults to 'http'.

    static_configs:
    - targets: ['localhost:9090']

Prometheus 默认的配置文件分为四大块:

  • global 块:Prometheus 的全局配置,比如 scrape_interval 表示 Prometheus 多久抓取一次数据,evaluation_interval 表示多久检测一次告警规则;
  • alerting 块:关于 Alertmanager 的配置,这个我们后面再看;
  • rule_files 块:告警规则,这个我们后面再看;
  • scrape_config 块:这里定义了 Prometheus 要抓取的目标,我们可以看到默认已经配置了一个名称为 prometheus 的 job,这是因为 Prometheus 在启动的时候也会通过 HTTP 接口暴露自身的指标数据,这就相当于 Prometheus 自己监控自己,虽然这在真正使用 Prometheus 时没啥用处,但是我们可以通过这个例子来学习如何使用 Prometheus;可以访问 http://localhost:9090/metrics 查看 Prometheus 暴露了哪些指标;

更多的配置参数可以参考 这里

三、学习 PromQL

通过上面的步骤安装好 Prometheus 之后,我们现在可以开始体验 Prometheus 了。Prometheus 提供了可视化的 Web UI 方便我们操作,直接访问 http://localhost:9090/ 即可,它默认会跳转到 Graph 页面:

prometheus-index.jpg

第一次访问这个页面可能会不知所措,我们可以先看看其他菜单下的内容,比如:Alerts 展示了定义的所有告警规则,Status 可以查看各种 Prometheus 的状态信息,有 Runtime & Build Information、Command-Line Flags、Configuration、Rules、Targets、Service Discovery 等等。

实际上 Graph 页面才是 Prometheus 最强大的功能,在这里我们可以使用 Prometheus 提供的一种特殊表达式来查询监控数据,这个表达式被称为 PromQL(Prometheus Query Language)。通过 PromQL 不仅可以在 Graph 页面查询数据,而且还可以通过 Prometheus 提供的 HTTP API 来查询。查询的监控数据有列表和曲线图两种展现形式(对应上图中 Console 和 Graph 这两个标签)。

我们上面说过,Prometheus 自身也暴露了很多的监控指标,也可以在 Graph 页面查询,展开 Execute 按钮旁边的下拉框,可以看到很多指标名称,我们随便选一个,譬如:promhttp_metric_handler_requests_total,这个指标表示 /metrics 页面的访问次数,Prometheus 就是通过这个页面来抓取自身的监控数据的。在 Console 标签中查询结果如下:

prometheus-console.jpg

上面在介绍 Prometheus 的配置文件时,可以看到 scrape_interval 参数是 15s,也就是说 Prometheus 每 15s 访问一次 /metrics 页面,所以我们过 15s 刷新下页面,可以看到指标值会自增。在 Graph 标签中可以看得更明显:

prometheus-graph.jpg

3.1 数据模型

要学习 PromQL,首先我们需要了解下 Prometheus 的数据模型,一条 Prometheus 数据由一个指标名称(metric)和 N 个标签(label,N >= 0)组成的,比如下面这个例子:

promhttp_metric_handler_requests_total{code="200",instance="192.168.0.107:9090",job="prometheus"} 106

这条数据的指标名称为 promhttp_metric_handler_requests_total,并且包含三个标签 codeinstancejob,这条记录的值为 106。上面说过,Prometheus 是一个时序数据库,相同指标相同标签的数据构成一条时间序列。如果以传统数据库的概念来理解时序数据库,可以把指标名当作表名,标签是字段,timestamp 是主键,还有一个 float64 类型的字段表示值(Prometheus 里面所有值都是按 float64 存储)。

这种数据模型和 OpenTSDB 的数据模型是比较类似的,详细的信息可以参考官网文档 Data model。另外,关于指标和标签的命名,官网有一些指导性的建议,可以参考 Metric and label naming

虽然 Prometheus 里存储的数据都是 float64 的一个数值,但如果我们按类型来分,可以把 Prometheus 的数据分成四大类:

  • Counter
  • Gauge
  • Histogram
  • Summary

Counter 用于计数,例如:请求次数、任务完成数、错误发生次数,这个值会一直增加,不会减少。Gauge 就是一般的数值,可大可小,例如:温度变化、内存使用变化。Histogram 是直方图,或称为柱状图,常用于跟踪事件发生的规模,例如:请求耗时、响应大小。它特别之处是可以对记录的内容进行分组,提供 count 和 sum 的功能。Summary 和 Histogram 十分相似,也用于跟踪事件发生的规模,不同之处是,它提供了一个 quantiles 的功能,可以按百分比划分跟踪的结果。例如:quantile 取值 0.95,表示取采样值里面的 95% 数据。更多信息可以参考官网文档 Metric types,Summary 和 Histogram 的概念比较容易混淆,属于比较高阶的指标类型,可以参考 Histograms and summaries 这里的说明。

这四种类型的数据只在指标的提供方作区分,也就是上面说的 Exporter,如果你需要编写自己的 Exporter 或者在现有系统中暴露供 Prometheus 抓取的指标,你可以使用 Prometheus client libraries,这个时候你就需要考虑不同指标的数据类型了。如果你不用自己实现,而是直接使用一些现成的 Exporter,然后在 Prometheus 里查查相关的指标数据,那么可以不用太关注这块,不过理解 Prometheus 的数据类型,对写出正确合理的 PromQL 也是有帮助的。

3.2 PromQL 入门

我们从一些例子开始学习 PromQL,最简单的 PromQL 就是直接输入指标名称,比如:

# 表示 Prometheus 能否抓取 target 的指标,用于 target 的健康检查
up

这条语句会查出 Prometheus 抓取的所有 target 当前运行情况,譬如下面这样:

up{instance="192.168.0.107:9090",job="prometheus"}    1
up{instance="192.168.0.108:9090",job="prometheus"}    1
up{instance="192.168.0.107:9100",job="server"}    1
up{instance="192.168.0.108:9104",job="mysql"}    0

也可以指定某个 label 来查询:

up{job="prometheus"}

这种写法被称为 Instant vector selectors,这里不仅可以使用 = 号,还可以使用 !==~!~,比如下面这样:

up{job!="prometheus"}
up{job=~"server|mysql"}
up{job=~"192\.168\.0\.107.+"}

=~ 是根据正则表达式来匹配,必须符合 RE2 的语法

和 Instant vector selectors 相应的,还有一种选择器,叫做 Range vector selectors,它可以查出一段时间内的所有数据:

http_requests_total[5m]

这条语句查出 5 分钟内所有抓取的 HTTP 请求数,注意它返回的数据类型是 Range vector,没办法在 Graph 上显示成曲线图,一般情况下,会用在 Counter 类型的指标上,并和 rate()irate() 函数一起使用(注意 rate 和 irate 的区别)。

# 计算的是每秒的平均值,适用于变化很慢的 counter
# per-second average rate of increase, for slow-moving counters
rate(http_requests_total[5m])

# 计算的是每秒瞬时增加速率,适用于变化很快的 counter
# per-second instant rate of increase, for volatile and fast-moving counters
irate(http_requests_total[5m])

此外,PromQL 还支持 countsumminmaxtopk聚合操作,还支持 rateabsceilfloor 等一堆的 内置函数更多的例子,还是上官网学习吧。如果感兴趣,我们还可以把 PromQL 和 SQL 做一个对比,会发现 PromQL 语法更简洁,查询性能也更高。

3.3 HTTP API

我们不仅仅可以在 Prometheus 的 Graph 页面查询 PromQL,Prometheus 还提供了一种 HTTP API 的方式,可以更灵活的将 PromQL 整合到其他系统中使用,譬如下面要介绍的 Grafana,就是通过 Prometheus 的 HTTP API 来查询指标数据的。实际上,我们在 Prometheus 的 Graph 页面查询也是使用了 HTTP API。

我们看下 Prometheus 的 HTTP API 官方文档,它提供了下面这些接口:

  • GET /api/v1/query
  • GET /api/v1/query_range
  • GET /api/v1/series
  • GET /api/v1/label/<label_name>/values
  • GET /api/v1/targets
  • GET /api/v1/rules
  • GET /api/v1/alerts
  • GET /api/v1/targets/metadata
  • GET /api/v1/alertmanagers
  • GET /api/v1/status/config
  • GET /api/v1/status/flags

从 Prometheus v2.1 开始,又新增了几个用于管理 TSDB 的接口:

  • POST /api/v1/admin/tsdb/snapshot
  • POST /api/v1/admin/tsdb/delete_series
  • POST /api/v1/admin/tsdb/clean_tombstones

四、安装 Grafana

虽然 Prometheus 提供的 Web UI 也可以很好的查看不同指标的视图,但是这个功能非常简单,只适合用来调试。要实现一个强大的监控系统,还需要一个能定制展示不同指标的面板,能支持不同类型的展现方式(曲线图、饼状图、热点图、TopN 等),这就是仪表盘(Dashboard)功能。因此 Prometheus 开发了一套仪表盘系统 PromDash,不过很快这套系统就被废弃了,官方开始推荐使用 Grafana 来对 Prometheus 的指标数据进行可视化,这不仅是因为 Grafana 的功能非常强大,而且它和 Prometheus 可以完美的无缝融合。

Grafana 是一个用于可视化大型测量数据的开源系统,它的功能非常强大,界面也非常漂亮,使用它可以创建自定义的控制面板,你可以在面板中配置要显示的数据和显示方式,它 支持很多不同的数据源,比如:Graphite、InfluxDB、OpenTSDB、Elasticsearch、Prometheus 等,而且它也 支持众多的插件

下面我们就体验下使用 Grafana 来展示 Prometheus 的指标数据。首先我们来安装 Grafana,我们使用最简单的 Docker 安装方式

$ docker run -d -p 3000:3000 grafana/grafana

运行上面的 docker 命令,Grafana 就安装好了!你也可以采用其他的安装方式,参考 官方的安装文档。安装完成之后,我们访问 http://localhost:3000/ 进入 Grafana 的登陆页面,输入默认的用户名和密码(admin/admin)即可。

grafana-home.jpg

要使用 Grafana,第一步当然是要配置数据源,告诉 Grafana 从哪里取数据,我们点击 Add data source 进入数据源的配置页面:

grafana-datasource-config.jpg

我们在这里依次填上:

要注意的是,这里的 Access 指的是 Grafana 访问数据源的方式,有 Browser 和 Proxy 两种方式。Browser 方式表示当用户访问 Grafana 面板时,浏览器直接通过 URL 访问数据源的;而 Proxy 方式表示浏览器先访问 Grafana 的某个代理接口(接口地址是 /api/datasources/proxy/),由 Grafana 的服务端来访问数据源的 URL,如果数据源是部署在内网,用户通过浏览器无法直接访问时,这种方式非常有用。

配置好数据源,Grafana 会默认提供几个已经配置好的面板供你使用,如下图所示,默认提供了三个面板:Prometheus Stats、Prometheus 2.0 Stats 和 Grafana metrics。点击 Import 就可以导入并使用该面板。

grafana-datasource-dashboards.jpg

我们导入 Prometheus 2.0 Stats 这个面板,可以看到下面这样的监控面板。如果你的公司有条件,可以申请个大显示器挂在墙上,将这个面板投影在大屏上,实时观察线上系统的状态,可以说是非常 cool 的。

grafana-prometheus-stats.jpg

五、使用 Exporter 收集指标

目前为止,我们看到的都还只是一些没有实际用途的指标,如果我们要在我们的生产环境真正使用 Prometheus,往往需要关注各种各样的指标,譬如服务器的 CPU负载、内存占用量、IO开销、入网和出网流量等等。正如上面所说,Prometheus 是使用 Pull 的方式来获取指标数据的,要让 Prometheus 从目标处获得数据,首先必须在目标上安装指标收集的程序,并暴露出 HTTP 接口供 Prometheus 查询,这个指标收集程序被称为 Exporter,不同的指标需要不同的 Exporter 来收集,目前已经有大量的 Exporter 可供使用,几乎囊括了我们常用的各种系统和软件,官网列出了一份 常用 Exporter 的清单,各个 Exporter 都遵循一份端口约定,避免端口冲突,即从 9100 开始依次递增,这里是 完整的 Exporter 端口列表。另外值得注意的是,有些软件和系统无需安装 Exporter,这是因为他们本身就提供了暴露 Prometheus 格式的指标数据的功能,比如 Kubernetes、Grafana、Etcd、Ceph 等。

这一节就让我们来收集一些有用的数据。

5.1 收集服务器指标

首先我们来收集服务器的指标,这需要安装 node_exporter,这个 exporter 用于收集 *NIX 内核的系统,如果你的服务器是 Windows,可以使用 WMI exporter

和 Prometheus server 一样,node_exporter 也是开箱即用的:

$ wget https://github.com/prometheus/node_exporter/releases/download/v0.16.0/node_exporter-0.16.0.linux-amd64.tar.gz
$ tar xvfz node_exporter-0.16.0.linux-amd64.tar.gz
$ cd node_exporter-0.16.0.linux-amd64
$ ./node_exporter

node_exporter 启动之后,我们访问下 /metrics 接口看看是否能正常获取服务器指标:

$ curl http://localhost:9100/metrics

如果一切 OK,我们可以修改 Prometheus 的配置文件,将服务器加到 scrape_configs 中:

scrape_configs:
  - job_name: 'prometheus'
    static_configs:
      - targets: ['192.168.0.107:9090']
  - job_name: 'server'
    static_configs:
      - targets: ['192.168.0.107:9100']

修改配置后,需要重启 Prometheus 服务,或者发送 HUP 信号也可以让 Prometheus 重新加载配置:

$ killall -HUP prometheus

在 Prometheus Web UI 的 Status -> Targets 中,可以看到新加的服务器:

prometheus-targets.jpg

在 Graph 页面的指标下拉框可以看到很多名称以 node 开头的指标,譬如我们输入 node_load1 观察服务器负载:

prometheus-node-load1.jpg

如果想在 Grafana 中查看服务器的指标,可以在 Grafana 的 Dashboards 页面 搜索 node exporter,有很多的面板模板可以直接使用,譬如:Node Exporter Server Metrics 或者 Node Exporter Full 等。我们打开 Grafana 的 Import dashboard 页面,输入面板的 URL(https://grafana.com/dashboards/405)或者 ID(405)即可。

grafana-node-exporter.jpg

注意事项

一般情况下,node_exporter 都是直接运行在要收集指标的服务器上的,官方不推荐用 Docker 来运行 node_exporter。如果逼不得已一定要运行在 Docker 里,要特别注意,这是因为 Docker 的文件系统和网络都有自己的 namespace,收集的数据并不是宿主机真实的指标。可以使用一些变通的方法,比如运行 Docker 时加上下面这样的参数:

docker run -d \
  --net="host" \
  --pid="host" \
  -v "/:/host:ro,rslave" \
  quay.io/prometheus/node-exporter \
  --path.rootfs /host

关于 node_exporter 的更多信息,可以参考 node_exporter 的文档 和 Prometheus 的官方指南 Monitoring Linux host metrics with the Node Exporter,另外,Julius Volz 的这篇文章 How To Install Prometheus using Docker on Ubuntu 14.04 也是很好的入门材料。

5.2 收集 MySQL 指标

mysqld_exporter 是 Prometheus 官方提供的一个 exporter,我们首先 下载最新版本 并解压(开箱即用):

$ wget https://github.com/prometheus/mysqld_exporter/releases/download/v0.11.0/mysqld_exporter-0.11.0.linux-amd64.tar.gz
$ tar xvfz mysqld_exporter-0.11.0.linux-amd64.tar.gz
$ cd mysqld_exporter-0.11.0.linux-amd64/

mysqld_exporter 需要连接到 mysqld 才能收集它的指标,可以通过两种方式来设置 mysqld 数据源。第一种是通过环境变量 DATA_SOURCE_NAME,这被称为 DSN(数据源名称),它必须符合 DSN 的格式,一个典型的 DSN 格式像这样:user:password@(host:port)/

$ export DATA_SOURCE_NAME='root:123456@(192.168.0.107:3306)/'
$ ./mysqld_exporter

另一种方式是通过配置文件,默认的配置文件是 ~/.my.cnf,或者通过 --config.my-cnf 参数指定:

$ ./mysqld_exporter --config.my-cnf=".my.cnf"

配置文件的格式如下:

$ cat .my.cnf
[client]
host=localhost
port=3306
user=root
password=123456

如果要把 MySQL 的指标导入 Grafana,可以参考 这些 Dashboard JSON

注意事项

这里为简单起见,在 mysqld_exporter 中直接使用了 root 连接数据库,在真实环境中,可以为 mysqld_exporter 创建一个单独的用户,并赋予它受限的权限(PROCESS、REPLICATION CLIENT、SELECT),最好还限制它的最大连接数(MAX_USER_CONNECTIONS)。

CREATE USER 'exporter'@'localhost' IDENTIFIED BY 'password' WITH MAX_USER_CONNECTIONS 3;
GRANT PROCESS, REPLICATION CLIENT, SELECT ON *.* TO 'exporter'@'localhost';

5.3 收集 Nginx 指标

官方提供了两种收集 Nginx 指标的方式。第一种是 Nginx metric library,这是一段 Lua 脚本(prometheus.lua),Nginx 需要开启 Lua 支持(libnginx-mod-http-lua 模块)。为方便起见,也可以使用 OpenResty 的 OPM(OpenResty Package Manager) 或者 luarocks(The Lua package manager) 来安装。第二种是 Nginx VTS exporter,这种方式比第一种要强大的多,安装要更简单,支持的指标也更丰富,它依赖于 nginx-module-vts 模块,vts 模块可以提供大量的 Nginx 指标数据,可以通过 JSON、HTML 等形式查看这些指标。Nginx VTS exporter 就是通过抓取 /status/format/json 接口来将 vts 的数据格式转换为 Prometheus 的格式。不过,在 nginx-module-vts 最新的版本中增加了一个新接口:/status/format/prometheus,这个接口可以直接返回 Prometheus 的格式,从这点这也能看出 Prometheus 的影响力,估计 Nginx VTS exporter 很快就要退役了(TODO:待验证)。

除此之外,还有很多其他的方式来收集 Nginx 的指标,比如:nginx_exporter 通过抓取 Nginx 自带的统计页面 /nginx_status 可以获取一些比较简单的指标(需要开启 ngx_http_stub_status_module 模块);nginx_request_exporter 通过 syslog 协议 收集并分析 Nginx 的 access log 来统计 HTTP 请求相关的一些指标;nginx-prometheus-shiny-exporter 和 nginx_request_exporter 类似,也是使用 syslog 协议来收集 access log,不过它是使用 Crystal 语言 写的。还有 vovolie/lua-nginx-prometheus 基于 Openresty、Prometheus、Consul、Grafana 实现了针对域名和 Endpoint 级别的流量统计。

有需要或感兴趣的同学可以对照说明文档自己安装体验下,这里就不一一尝试了。

5.4 收集 JMX 指标

最后让我们来看下如何收集 Java 应用的指标,Java 应用的指标一般是通过 JMX(Java Management Extensions) 来获取的,顾名思义,JMX 是管理 Java 的一种扩展,它可以方便的管理和监控正在运行的 Java 程序。

JMX Exporter 用于收集 JMX 指标,很多使用 Java 的系统,都可以使用它来收集指标,比如:Kafaka、Cassandra 等。首先我们下载 JMX Exporter:

$ wget https://repo1.maven.org/maven2/io/prometheus/jmx/jmx_prometheus_javaagent/0.3.1/jmx_prometheus_javaagent-0.3.1.jar

JMX Exporter 是一个 Java Agent 程序,在运行 Java 程序时通过 -javaagent 参数来加载:

$ java -javaagent:jmx_prometheus_javaagent-0.3.1.jar=9404:config.yml -jar spring-boot-sample-1.0-SNAPSHOT.jar

其中,9404 是 JMX Exporter 暴露指标的端口,config.yml 是 JMX Exporter 的配置文件,它的内容可以 参考 JMX Exporter 的配置说明 。然后检查下指标数据是否正确获取:

$ curl http://localhost:9404/metrics

六、告警和通知

至此,我们能收集大量的指标数据,也能通过强大而美观的面板展示出来。不过作为一个监控系统,最重要的功能,还是应该能及时发现系统问题,并及时通知给系统负责人,这就是 Alerting(告警)。Prometheus 的告警功能被分成两部分:一个是告警规则的配置和检测,并将告警发送给 Alertmanager,另一个是 Alertmanager,它负责管理这些告警,去除重复数据,分组,并路由到对应的接收方式,发出报警。常见的接收方式有:Email、PagerDuty、HipChat、Slack、OpsGenie、WebHook 等。

6.1 配置告警规则

我们在上面介绍 Prometheus 的配置文件时了解到,它的默认配置文件 prometheus.yml 有四大块:global、alerting、rule_files、scrape_config,其中 rule_files 块就是告警规则的配置项,alerting 块用于配置 Alertmanager,这个我们下一节再看。现在,先让我们在 rule_files 块中添加一个告警规则文件:

rule_files:
  - "alert.rules"

然后参考 官方文档,创建一个告警规则文件 alert.rules

groups:
- name: example
  rules:

  # Alert for any instance that is unreachable for >5 minutes.
  - alert: InstanceDown
    expr: up == 0
    for: 5m
    labels:
      severity: page
    annotations:
      summary: "Instance {{ $labels.instance }} down"
      description: "{{ $labels.instance }} of job {{ $labels.job }} has been down for more than 5 minutes."

  # Alert for any instance that has a median request latency >1s.
  - alert: APIHighRequestLatency
    expr: api_http_request_latencies_second{quantile="0.5"} > 1
    for: 10m
    annotations:
      summary: "High request latency on {{ $labels.instance }}"
      description: "{{ $labels.instance }} has a median request latency above 1s (current value: {{ $value }}s)"

这个规则文件里,包含了两条告警规则:InstanceDownAPIHighRequestLatency。顾名思义,InstanceDown 表示当实例宕机时(up === 0)触发告警,APIHighRequestLatency 表示有一半的 API 请求延迟大于 1s 时(api_http_request_latencies_second{quantile="0.5"} > 1)触发告警。配置好后,需要重启下 Prometheus server,然后访问 http://localhost:9090/rules 可以看到刚刚配置的规则:

prometheus-rules.jpg

访问 http://localhost:9090/alerts 可以看到根据配置的规则生成的告警:

prometheus-alerts.jpg

这里我们将一个实例停掉,可以看到有一条 alert 的状态是 PENDING,这表示已经触发了告警规则,但还没有达到告警条件。这是因为这里配置的 for 参数是 5m,也就是 5 分钟后才会触发告警,我们等 5 分钟,可以看到这条 alert 的状态变成了 FIRING

6.2 使用 Alertmanager 发送告警通知

虽然 Prometheus 的 /alerts 页面可以看到所有的告警,但是还差最后一步:触发告警时自动发送通知。这是由 Alertmanager 来完成的,我们首先 下载并安装 Alertmanager,和其他 Prometheus 的组件一样,Alertmanager 也是开箱即用的:

$ wget https://github.com/prometheus/alertmanager/releases/download/v0.15.2/alertmanager-0.15.2.linux-amd64.tar.gz
$ tar xvfz alertmanager-0.15.2.linux-amd64.tar.gz
$ cd alertmanager-0.15.2.linux-amd64
$ ./alertmanager

Alertmanager 启动后默认可以通过 http://localhost:9093/ 来访问,但是现在还看不到告警,因为我们还没有把 Alertmanager 配置到 Prometheus 中,我们回到 Prometheus 的配置文件 prometheus.yml,添加下面几行:

alerting:
  alertmanagers:
  - scheme: http
    static_configs:
    - targets:
      - "192.168.0.107:9093"

这个配置告诉 Prometheus,当发生告警时,将告警信息发送到 Alertmanager,Alertmanager 的地址为 http://192.168.0.107:9093。也可以使用命名行的方式指定 Alertmanager:

$ ./prometheus -alertmanager.url=http://192.168.0.107:9093

这个时候再访问 Alertmanager,可以看到 Alertmanager 已经接收到告警了:

alertmanager-alerts.jpg

下面的问题就是如何让 Alertmanager 将告警信息发送给我们了,我们打开默认的配置文件 alertmanager.ym

global:
  resolve_timeout: 5m

route:
  group_by: ['alertname']
  group_wait: 10s
  group_interval: 10s
  repeat_interval: 1h
  receiver: 'web.hook'
receivers:
- name: 'web.hook'
  webhook_configs:
  - url: 'http://127.0.0.1:5001/'
inhibit_rules:
  - source_match:
      severity: 'critical'
    target_match:
      severity: 'warning'
    equal: ['alertname', 'dev', 'instance']

参考 官方的配置手册 了解各个配置项的功能,其中 global 块表示一些全局配置;route 块表示通知路由,可以根据不同的标签将告警通知发送给不同的 receiver,这里没有配置 routes 项,表示所有的告警都发送给下面定义的 web.hook 这个 receiver;如果要配置多个路由,可以参考 这个例子

  routes:
  - receiver: 'database-pager'
    group_wait: 10s
    match_re:
      service: mysql|cassandra

  - receiver: 'frontend-pager'
    group_by: [product, environment]
    match:
      team: frontend

紧接着,receivers 块表示告警通知的接收方式,每个 receiver 包含一个 name 和一个 xxx_configs,不同的配置代表了不同的接收方式,Alertmanager 内置了下面这些接收方式:

  • email_config
  • hipchat_config
  • pagerduty_config
  • pushover_config
  • slack_config
  • opsgenie_config
  • victorops_config
  • wechat_configs
  • webhook_config

虽然接收方式很丰富,但是在国内,其中大多数接收方式都很少使用。最常用到的,莫属 email_config 和 webhook_config,另外 wechat_configs 可以支持使用微信来告警,也是相当符合国情的了。

其实告警的通知方式是很难做到面面俱到的,因为消息软件各种各样,每个国家还可能不同,不可能完全覆盖到,所以 Alertmanager 已经决定不再添加新的 receiver 了,而是推荐使用 webhook 来集成自定义的接收方式。可以参考 这些集成的例子,譬如 将钉钉接入 Prometheus AlertManager WebHook

七、学习更多

到这里,我们已经学习了 Prometheus 的大多数功能,结合 Prometheus + Grafana + Alertmanager 完全可以搭建一套非常完整的监控系统。不过在真正使用时,我们会发现更多的问题。

7.1 服务发现

由于 Prometheus 是通过 Pull 的方式主动获取监控数据,所以需要手工指定监控节点的列表,当监控的节点增多之后,每次增加节点都需要更改配置文件,非常麻烦,这个时候就需要通过服务发现(service discovery,SD)机制去解决。Prometheus 支持多种服务发现机制,可以自动获取要收集的 targets,可以参考 这里,包含的服务发现机制包括:azure、consul、dns、ec2、openstack、file、gce、kubernetes、marathon、triton、zookeeper(nerve、serverset),配置方法可以参考手册的 Configuration 页面。可以说 SD 机制是非常丰富的,但目前由于开发资源有限,已经不再开发新的 SD 机制,只对基于文件的 SD 机制进行维护。

关于服务发现网上有很多教程,譬如 Prometheus 官方博客中这篇文章 Advanced Service Discovery in Prometheus 0.14.0 对此有一个比较系统的介绍,全面的讲解了 relabeling 配置,以及如何使用 DNS-SRV、Consul 和文件来做服务发现。另外,官网还提供了 一个基于文件的服务发现的入门例子,Julius Volz 写的 Prometheus workshop 入门教程中也 使用了 DNS-SRV 来当服务发现

7.2 告警配置管理

无论是 Prometheus 的配置还是 Alertmanager 的配置,都没有提供 API 供我们动态的修改。一个很常见的场景是,我们需要基于 Prometheus 做一套可自定义规则的告警系统,用户可根据自己的需要在页面上创建修改或删除告警规则,或者是修改告警通知方式和联系人,正如在 Prometheus Google Groups 里的 这个用户的问题:How to dynamically add alerts rules in rules.conf and prometheus yml file via API or something?不过遗憾的是,Simon Pasquier 在下面说到,目前并没有这样的 API,而且以后也没有这样的计划来开发这样的 API,因为这样的功能更应该交给譬如 Puppet、Chef、Ansible、Salt 这样的配置管理系统。

7.3 使用 Pushgateway

Pushgateway 主要用于收集一些短期的 jobs,由于这类 jobs 存在时间较短,可能在 Prometheus 来 Pull 之前就消失了。官方对 什么时候该使用 Pushgateway 有一个很好的说明。

总结

这篇博客参考了网络上大量关于 Prometheus 的中文资料,有文档,也有博客,比如 1046102779Prometheus 非官方中文手册宋佳洋 的电子书《Prometheus 实战》,在这里对这些原作者表示敬意。在 Prometheus 官方文档的 Media 页面,也提供了很多学习资源。

关于 Prometheus,还有非常重要的一部分内容这篇博客没有涉及到,正如博客一开头所讲的,Prometheus 是继 Kubernetes 之后第二个加入 CNCF 的项目,Prometheus 和 Docker、Kubernetes 的结合非常紧密,使用 Prometheus 作为 Docker 和 Kubernetes 的监控系统也越来越主流。关于 Docker 的监控,可以参考官网的一篇指南:Monitoring Docker container metrics using cAdvisor,它介绍了如何使用 cAdvisor 来对容器进行监控;不过 Docker 现在也开始原生支持 Prometheus 的监控了,参考 Docker 的官方文档 Collect Docker metrics with Prometheus;关于 Kubernetes 的监控,Kubernetes 中文社区 里有不少关于 Promehtheus 的资源,另外,《如何以优雅的姿势监控 Kubernetes》这本电子书也对 Kubernetes 的监控有一个比较全面的介绍。

最近两年 Prometheus 的发展非常迅速,社区也非常活跃,国内研究 Prometheus 的人也越来越多。随着微服务,DevOps,云计算,云原生等概念的普及,越来越多的企业开始使用 Docker 和 Kubernetes 来构建自己的系统和应用,像 Nagios 和 Cacti 这样的老牌监控系统会变得越来越不适用,相信 Prometheus 最终会发展成一个最适合云环境的监控系统。

附录:什么是时序数据库?

上文提到 Prometheus 是一款基于时序数据库的监控系统,时序数据库常简写为 TSDB(Time Series Database)。很多流行的监控系统都在使用时序数据库来保存数据,这是因为时序数据库的特点和监控系统不谋而合。

  • 增:需要频繁的进行写操作,而且是按时间排序顺序写入
  • 删:不需要随机删除,一般情况下会直接删除一个时间区块的所有数据
  • 改:不需要对写入的数据进行更新
  • 查:需要支持高并发的读操作,读操作是按时间顺序升序或降序读,数据量非常大,缓存不起作用

DB-Engines 上有一个关于时序数据库的排名,下面是排名靠前的几个(2018年10月):

另外,liubin 在他的博客上写了一个关于时序数据库的系列文章:时序列数据库武斗大会,推荐。

参考

  1. Prometheus 官方文档【英文】
  2. Prometheus 官方文档【中文】
  3. The History of Prometheus at SoundCloud
  4. Prometheus: Monitoring at SoundCloud
  5. Google And Friends Add Prometheus To Kubernetes Platform
  6. 云原生架构概述
  7. 还不了解 CNCF?关于 CNCF 的三问三答!
  8. 时序列数据库武斗大会之什么是TSDB
  9. 时序列数据库武斗大会之TSDB名录 Part 1
  10. Prometheus 入门
  11. Prometheus 初探
  12. 监控利器之 Prometheus
  13. 使用Prometheus+Grafana监控MySQL实践
  14. 使用Prometheus+grafana打造高逼格监控平台
  15. 初试 Prometheus + Grafana 监控系统搭建并监控 Mysql
  16. 使用Prometheus和Grafana监控Mysql服务器性能
  17. 使用Prometheus监控服务器
  18. Prometheus 入门与实践
  19. 基于Prometheus的分布式在线服务监控实践
  20. grafana+ prometheus+php 监控系统实践
  21. Grafana+prometheus+php 自动创建监控图
  22. Prometheus+Grafana监控部署实践
  23. How To Install Prometheus using Docker on Ubuntu 14.04

新技术学习笔记:RabbitMQ

在分布式系统中,消息队列(Message Queue,简称 MQ) 用于交换系统之间的信息,是一个非常重要的中间组件。早在上世纪 80 年代,就已经有消息队列的概念了,不过当时叫做 TIB(The Information Bus),当时的消息队列大多是商业产品,直到 2001 年 Java 标准化组织(JCP)提出 JSR 914: Java Message Service (JMS) API,这是一个与平台无关的 API,为 Java 应用提供了统一的消息操作。 JMS 提供了两种消息模型:点对点(peer-2-peer)和发布订阅(publish-subscribe)模型,当前的大多数消息队列产品都可以支持 JMS,譬如:Apache ActiveMQ、RabbitMQ、Kafka 等。

不过,JMS 毕竟是一套 Java 规范,是和编程语言绑定在一起的,只能在 Java 类语言(比如 Scala、Groovy)中具有互用性,也就是说消息的生产者(Producer)和消费者(Consumer)都得用 Java 来编写。如何让不同的编程语言或平台相互通信呢?对于这个问题,摩根大通的 John O'Hara 在 2003 年提出了 AMQP(Advanced Message Queuing Protocol,高级消息队列协议)的概念,可以解决不同平台之间的消息传递交互问题,2004 到 2006 年之间,摩根大通和 iMatrix 公司一起着手 AMQP 标准的开发,并于 2006 年发布 AMQP 规范。AMQP 和 JMS 最大的区别在于它是一种通用的消息协议,更准确的说是一种 Wire Protocol(链接协议),AMQP 并不去限定 API 层的实现,而是只定义网络交换的数据格式,这和 HTTP 协议是类似的,使得 AMQP 天然就是跨平台的。

在之后的 2007 年,Rabbit 技术公司基于 AMQP 标准发布了 RabbitMQ 第一个版本。RabbitMQ 采用了 Erlang 语言开发,这是一种通用的面向并发的编程语言,使得 RabbitMQ 具有高性能、高并发的特点,不仅如此,RabbitMQ 还提供了集群扩展的能力,易于使用以及强大的开源社区支持,这让 RabbitMQ 在开源消息队列的产品中占有重要的一席之地。

rabbitmq.png

一、RabbitMQ 安装

RabbitMQ 是用 Erlang 语言开发的,所以安装 RabbitMQ 之前,首先要安装 Erlang,在 Windows 上安装 Erlang 非常简单,直接去官网下载 Erlang OTP 的安装包文件并按提示点击安装即可。安装完成之后,我们就可以从 RabbitMQ 的官网下载和安装 RabbitMQ。其他操作系统的安装参考 Downloading and Installing RabbitMQ

一切就绪后,我们运行 RabbitMQ Command Prompt,如果你采用的是 RabbitMQ 的默认安装路径,命令提示符会显示:

C:\Program Files\RabbitMQ Server\rabbitmq_server-3.7.7\sbin>

我们使用命令 rabbitmqctl status 查看 RabbitMQ 的服务状态:

$ rabbitmqctl status
Status of node rabbit@LAPTOP-MBA74KRU ...
[{pid,4248},
 {running_applications,
     [{rabbitmq_management,"RabbitMQ Management Console","3.7.7"},
      {rabbitmq_web_dispatch,"RabbitMQ Web Dispatcher","3.7.7"},
      {cowboy,"Small, fast, modern HTTP server.","2.2.2"},
      {amqp_client,"RabbitMQ AMQP Client","3.7.7"},
      {rabbitmq_management_agent,"RabbitMQ Management Agent","3.7.7"},
      {rabbit,"RabbitMQ","3.7.7"},
      {rabbit_common,"Modules shared by rabbitmq-server and rabbitmq-erlang-client","3.7.7"},
      {recon,"Diagnostic tools for production use","2.3.2"},
      {ranch_proxy_protocol,"Ranch Proxy Protocol Transport","1.5.0"},
      {ranch,"Socket acceptor pool for TCP protocols.","1.5.0"},
      {ssl,"Erlang/OTP SSL application","9.0"},
      {mnesia,"MNESIA  CXC 138 12","4.15.4"},
      {public_key,"Public key infrastructure","1.6"},
      {asn1,"The Erlang ASN1 compiler version 5.0.6","5.0.6"},
      {os_mon,"CPO  CXC 138 46","2.4.5"},
      {cowlib,"Support library for manipulating Web protocols.","2.1.0"},
      {jsx,"a streaming, evented json parsing toolkit","2.8.2"},
      {xmerl,"XML parser","1.3.17"},
      {inets,"INETS  CXC 138 49","7.0"},
      {crypto,"CRYPTO","4.3"},
      {lager,"Erlang logging framework","3.6.3"},
      {goldrush,"Erlang event stream processor","0.1.9"},
      {compiler,"ERTS  CXC 138 10","7.2.1"},
      {syntax_tools,"Syntax tools","2.1.5"},
      {syslog,"An RFC 3164 and RFC 5424 compliant logging framework.","3.4.2"},
      {sasl,"SASL  CXC 138 11","3.2"},
      {stdlib,"ERTS  CXC 138 10","3.5"},
      {kernel,"ERTS  CXC 138 10","6.0"}]},
 {listeners,
     [{clustering,25672,"::"},
      {amqp,5672,"::"},
      {amqp,5672,"0.0.0.0"},
      {http,15672,"::"},
      {http,15672,"0.0.0.0"}]},
 {vm_memory_calculation_strategy,rss},
 {vm_memory_high_watermark,0.4},
 {vm_memory_limit,3380019200},
 {disk_free_limit,50000000},
 {disk_free,358400446464},
 {run_queue,1},
 {uptime,6855},
 {kernel,{net_ticktime,60}}]

一般情况下,我们还会安装 RabbitMQ Management Plugin,先用 rabbitmq-plugins list 列出所有支持的插件:

$ rabbitmq-plugins list
Listing plugins with pattern ".*" ...
 Configured: E = explicitly enabled; e = implicitly enabled
 | Status: * = running on rabbit@LAPTOP-MBA74KRU
 |/
[  ] rabbitmq_amqp1_0                  3.7.7
[  ] rabbitmq_auth_backend_cache       3.7.7
[  ] rabbitmq_auth_backend_http        3.7.7
[  ] rabbitmq_auth_backend_ldap        3.7.7
[  ] rabbitmq_auth_mechanism_ssl       3.7.7
[  ] rabbitmq_consistent_hash_exchange 3.7.7
[  ] rabbitmq_event_exchange           3.7.7
[  ] rabbitmq_federation               3.7.7
[  ] rabbitmq_federation_management    3.7.7
[  ] rabbitmq_jms_topic_exchange       3.7.7
[E*] rabbitmq_management               3.7.7
[e*] rabbitmq_management_agent         3.7.7
[  ] rabbitmq_mqtt                     3.7.7
[  ] rabbitmq_peer_discovery_aws       3.7.7
[  ] rabbitmq_peer_discovery_common    3.7.7
[  ] rabbitmq_peer_discovery_consul    3.7.7
[  ] rabbitmq_peer_discovery_etcd      3.7.7
[  ] rabbitmq_peer_discovery_k8s       3.7.7
[  ] rabbitmq_random_exchange          3.7.7
[  ] rabbitmq_recent_history_exchange  3.7.7
[  ] rabbitmq_sharding                 3.7.7
[  ] rabbitmq_shovel                   3.7.7
[  ] rabbitmq_shovel_management        3.7.7
[  ] rabbitmq_stomp                    3.7.7
[  ] rabbitmq_top                      3.7.7
[  ] rabbitmq_tracing                  3.7.7
[  ] rabbitmq_trust_store              3.7.7
[e*] rabbitmq_web_dispatch             3.7.7
[  ] rabbitmq_web_mqtt                 3.7.7
[  ] rabbitmq_web_mqtt_examples        3.7.7
[  ] rabbitmq_web_stomp                3.7.7
[  ] rabbitmq_web_stomp_examples       3.7.7

使用下面的命令启用 Management Plugin

$ rabbitmq-plugins enable rabbitmq_management
Enabling plugins on node rabbit@LAPTOP-MBA74KRU:
rabbitmq_management
The following plugins have been configured:
  rabbitmq_management
  rabbitmq_management_agent
  rabbitmq_web_dispatch
Applying plugin configuration to rabbit@LAPTOP-MBA74KRU...
The following plugins have been enabled:
  rabbitmq_management
  rabbitmq_management_agent
  rabbitmq_web_dispatch

started 3 plugins.

然后访问 http://localhost:15672/ 就可以通过 Web UI 对 RabbitMQ 进行管理了(默认的用户名和密码是:guest/guest):

rabbitmq-webui-management.jpg

在生产环境安装 RabbitMQ 时,为了安全起见,我们最好在 Admin 标签下的 Users 里添加新的用户,并将 guest 用户移除。或者通过 rabbitmqctl 命令行:

$ rabbitmqctl add_vhost [vhost]
$ rabbitmqctl add_user [username] [password]  
$ rabbitmqctl set_user_tags [username] administrator  
$ rabbitmqctl set_permissions -p [vhost] [username] ".*" ".*" ".*"

关于 RabbitMQ 的安装,我们常常采用集群的形式,并且要保证消息队列服务的高可用性。这里有一篇文章可以参考《RabbitMQ集群安装配置+HAproxy+Keepalived高可用》

二、RabbitMQ 核心概念

RabbitMQ 中有一些概念需要我们在使用前先搞清楚,主要包括以下几个:Broker、Virtual Host、Exchange、Queue、Binding、Routing Key、Producer、Consumer、Connection、Channel。这些概念之间的关系如下图所示(图片来源):

rabbitmq-model.jpg

  1. Broker
    简单来说就是消息队列服务器的实体,类似于 JMS 规范中的 JMS provider。它用于接收和分发消息,有时候也称为 Message Broker 或者更直白的称为 RabbitMQ Server。
  2. Virtual Host
    和 Web 服务器中的虚拟主机(Virtual Host)是类似的概念,出于多租户和安全因素设计的,可以将 RabbitMQ Server 划分成多个独立的空间,彼此之间互相独立,这样就可以将一个 RabbitMQ Server 同时提供给多个用户使用,每个用户在自己的空间内创建 Exchange 和 Queue。
  3. Exchange
    交换机用于接收消息,这是消息到达 Broker 的第一站,然后根据交换机的类型和路由规则(Routing Key),将消息分发到特定的队列中去。常用的交换机类型有:direct (point-to-point)、topic (publish-subscribe) 和 fanout (multicast)。
  4. Queue
    生产者发送的消息就是存储在这里,在 JMS 规范里,没有 Exchange 的概念,消息是直接发送到 Queue,而在 AMQP 中,消息会经过 Exchange,由 Exchange 来将消息分发到各个队列中。消费者可以直接从这里取走消息。
  5. Binding
    绑定的作用就是把 Exchange 和 Queue 按照路由规则绑定起来,路由规则可由下面的 Routing Key 指定。
  6. Routing Key
    路由关键字,Exchange 根据这个关键字进行消息投递。
  7. Producer/Publisher
    消息生产者或发布者,产生消息的程序。
  8. Consumer/Subscriber
    消息消费者或订阅者,接收消息的程序。
  9. Connection
    生产者和消费者和 Broker 之间的连接,一个 Connection 实际上就对应着一条 TCP 连接。
  10. Channel
    由于 TCP 连接的创建和关闭开销非常大,如果每次访问 Broker 都建立一个 Connection,在消息量大的时候效率会非常低。Channel 是在 Connection 内部建立的逻辑连接,相当于一次会话,如果应用程序支持多线程,通常每个线程都会创建一个单独的 Channel 进行通讯,各个 Channel 之间完全隔离,但这些 Channel 可以公用一个 Connection。

关于 RabbitMQ 中的这些核心概念,实际上也是 AMQP 协议中的核心概念,可以参考官网上对 AMQP 协议的介绍:AMQP 0-9-1 Model ExplainedAMQP 0-9-1 Quick Reference

三、RabbitMQ 实战

这一节通过一些简单的 RabbitMQ 实例学习上面介绍的各个概念,这样可以对 RabbitMQ 的理念有个更深入的了解。

想要完整的学习 RabbitMQ,建议把 官网的 6 个例子 挨个实践一把,这 6 个例子非常经典,网上很多 RabbitMQ 的教程都是围绕这 6 个例子展开的。我们知道 AMQP 是跨平台的,支持绝大多数的编程语言,所以官网提供的这些例子也几乎囊括了绝大多数的编程语言,如:Python、Java、Ruby、PHP、C# 等,而且针对 Java 甚至还提供了 Spring AMQP 的版本,实在是非常贴心了。你可以根据需要选择相应编程语言的例子,这里以 Java 为例,分别是:

如果觉得阅读英文比较费劲,网上也有大量的中文教程,譬如:RabbitMQ 中文文档轻松搞定RabbitMQ专栏:RabbitMQ从入门到精通RabbitMQ指南,内容都是围绕这 6 个例子展开的。

rabbitmq-examples.png

上面是这几个例子的示意图。

第一个例子实现了一个最简单的生产消费模型,介绍了生产者(Producer)、消费者(Consumer)、队列(Queue)和消息(Message)的基本概念和关系,通过这个例子,我们可以学习如何发送消息,如何接受消息,这是最基础的消息队列的功能,只有一个生产者,也只有一个消费者,虽然简单,但是在日常工作中,有时也会使用这样的模型来做系统模块之间的解耦。

当发送的消息是一个复杂的任务,消费者在接受到这个任务后需要进行大量的计算时,这个队列叫做工作队列(Work Queue)或者任务队列(Task Queue),消费者被称之为 Worker,一个工作队列一般需要多个 Worker 对任务进行分发处理,这种设计具有良好的扩展性,如果要处理的任务太多,出现积压,只要简单的增加 Worker 数目即可。在第二个例子中实现了一个简单的工作队列模型,并介绍了两种任务调度的方法:循环调度公平调度,另外还学习了 消息确认消息持久化 的概念。

在第三个例子中介绍了发布/订阅模型(Publish/Subscribe)并构建了一个简单的日志系统,和前两个例子不一样的是,在这个例子中,所有的消费者都可以接受到生产者发送的消息,换句话说也就是,生产者发送的消息被广播给所有的消费者。在这个例子中我们学习了 交换机(Exchange) 的概念,在 RabbitMQ 的核心理念里,生产者不会直接发送消息给队列,而是发送给交换机,再由交换机将消息推送给特定的队列。消息从交换机推送到队列时会遵循一定的规则,这些规则就是 交换机类型(Exchange Type),常用的交换机类型有四种:直连交换机(direct)、主题交换机(topic)、头交换机(headers)和 扇型交换机(fanout)。值得注意的是,在前面的例子中没有指定交换机,实际上使用的是匿名交换机,这是一种特殊的直连交换机。而这个例子要实现的发布/订阅模型,实际上是扇型交换机。

在第四个例子中介绍了 路由(Routing)绑定(Bindings) 的概念。使用扇形交换机只能用来广播消息,没有足够的灵活性,可以使用直连交换机和路由来实现非常灵活的消息转发,在这个日志系统的例子中,我们根据日志的严重程度将消息投递到两个队列中,一个队列只接受 error 级别的日志,将日志保存到文件中,另一个队列接受所有级别的日志,并将日志输出到控制台。路由指的是生产者如何通过交换机将消息投递到特定队列,生产者一般首先通过 exchangeDeclare 声明好交换机,然后通过 basicPublish 将消息发送给该交换机,发送的时候可以指定一个 Routing Key 参数,交换机会根据交换机的类型和 Routing Key 参数将消息路由到某个队列。绑定是用来表示交换机和队列的关系,一般在消费者的代码中先通过 exchangeDeclarequeueDeclare 声明好交换机和队列,然后通过 queueBind 来将两者关联起来。在关联时,也可以指定一个 Routing Key 参数,为了和生产者的 Routing Key 区分开来,有时也叫做 Binding Key。只有生产者发送消息时指定的 Routing Key 和消费者绑定队列时指定的 Binding Key 完全一致时,消息才会被投递给该消费者声明的队列中。

从扇形交换机到直连交换机,再到主题交换机,实际上并没有太大的区别,只是路由的规则越来越细致和灵活。在第五个例子中,我们继续学习和改进这个简单的日志系统,消费者在订阅日志时,不仅要根据日志的严重程度,同时还希望根据日志的来源,像这种同时基于多个标准执行路由操作的情况,我们就要用到主题交换机。和直连交换机一样,在发送消息也需要指定一个 Routing Key,只不过这个 Routing Key 必须是以点号分割的特殊字符串,譬如 cron.info,kern.warn 等,消费者在绑定交换机和队列时也需要指定一个 Routing Key(Binding Key),这个 Binding Key 具有同样的格式,而且还可以使用一些特殊的匹配符来匹配路由(星号 * 匹配一个单词,井号 # 匹配任意数量单词),譬如 *.warn 可以用来匹配所有来源的警告日志。

在最后一个例子中,我们将学习更高级的主题,使用 RabbitMQ 实现一个远程过程调用(RPC)系统。这个例子和第二个例子介绍的工作队列是一样的,只不过在生产者将任务发送给消费者之后,还希望能从消费者那里得到任务的执行结果。这里生产者充当 RPC 系统中的客户端的角色,而消费者充当 RPC 系统中的服务器的角色。要实现 RPC 系统,必须声明两个队列,一个用来发送消息,一个用来接受回调。生产者在发送消息时,可以设置消息的属性,AMQP 协议中给消息预定义了 14 个属性,其中有一个属性叫做 reply_to,就是这里的回调队列。另外还有一个属性 correlation_id,可以将 RPC 的响应和请求关联起来。

所有例子的源码可以参考 这里,我就不一一列出了。下面仅对第二个例子(工作队列模型)的源码进行分析,因为这个例子很常用,我们在日常工作中会经常遇到。

首先我们来看生产者,我们省略掉创建和关闭 Connection、Channel 的部分,无论是生产者还是消费者,这个都是类似的。(完整代码

        channel.queueDeclare("hello-queue", false, false, false, null);
        for (int i = 1; i <= 10; i++) {
            String message = "Hello World" + StringUtils.repeat(".", i);
            channel.basicPublish("", "hello-queue", null, message.getBytes());
            System.out.println("Message Sent: " + message);
        }

可以看出生产者的核心代码实际上只有这两个函数:queueDeclare()basicPublish(),首先通过 queueDeclare() 函数声明一个队列 hello-queue,然后使用 basicPublish() 函数向这个队列发送消息。看到这里的代码你可能会有疑问,我们之前不是说在 RabbitMQ 里,生产者不会直接向队列发送消息,而是发送给交换机,再由交换机转发到各个队列吗?实际上,这里用到了 RabbitMQ 的 匿名转发(Nameless Exchange) 特性,在 RabbitMQ 里已经预置了几个交换机,比如:amq.direct、amq.fanout、amq.headers、amq.topic,它们的类型和它们的名字是一样的,amq.direct 就是 direct 类型的交换机,另外,还有一个空交换机,它也是 direct 类型,这个是 RabbitMQ 默认的交换机类型。一般情况下,我们在用 queueDeclare() 声明一个队列之后,还要用 queueBind() 绑定队列到某个交换机上,如下所示:

        channel.exchangeDeclare("hello-exchange", BuiltinExchangeType.DIRECT);
        channel.queueDeclare("hello-queue", false, false, false, null);
        channel.queueBind("hello-queue", "hello-exchange", "hello-key");

如果一个队列没有任何绑定,那么这个队列默认是绑定在空交换机上的。所以这里的生产者是将消息发送到空交换机,再由空交换机转发到 hello-queue 队列的。我们再来看消费者,下面的代码实现了任务的循环调度:(完整代码

        System.out.println(" [*] Waiting for messages. To exit press CTRL+C");
        channel.queueDeclare("hello-queue", false, false, false, null);
        channel.basicConsume("hello-queue", true, new DefaultConsumer(channel) {
            @Override
            public void handleDelivery(
                    String consumerTag,
                    Envelope envelope,
                    AMQP.BasicProperties properties,
                    byte[] body) throws IOException {
                try {
                    String message = new String(body, "UTF-8");
                    System.out.println("Message Recv: " + message);
                    int c = message.lastIndexOf(".") - message.indexOf(".");
                    if (c % 2 == 0) {
                        Thread.sleep(1000 * 5);
                    } else {
                        Thread.sleep(1000);
                    }
                } catch (Exception e) {
                    e.printStackTrace();
                }
            }
        });

在消费者的代码里,我们也用 queueDeclare() 声明了 hello-queue 队列,和生产者的代码是一样的。这里为什么既要在生产者里声明队列,又要在消费者里声明队列呢?而且我们在看其他例子的代码时也会发现,如果要用 exchangeDeclare() 声明交换机 也会同时出现在生产者和消费者中。为了搞清楚它的作用,我们可以把生产者或消费者的这行代码去掉,看看会发生什么:如果在消费者里不声明队列,下面的 basicConsume() 函数会直接抛出 NOT_FOUND 异常;如果在生产者里不声明队列,basicPublish() 发送的消息会全部丢失。所以,无论是生产者发送消息,还是消费者消费消息,都需要先创建队列才行。那么这个队列到底是谁创建的呢?答案是:谁先执行谁创建。创建队列的操作是 幂等 的,也就是说调用多次只会创建一次队列。要注意的是,如果两次创建的时候参数不一样,后创建的会报错:PRECONDITION_FAILED - inequivalent arg。

使用 basicConsume() 函数对某个队列的消息进行消费非常简单,它会一直阻塞,等待消息的到来,这个函数接受一个 DefaultConsumer 对象参数,可以重写该对象的 handleDelivery() 函数,一旦消息到来,就会使用这个回调函数对消息进行处理。我们启动多个消费者实例,由于这些消费者同时消费 hello-queue 队列,RabbitMQ 会将消息挨个分配给消费者,而且是提前一次性分配好,这样每个消费者得到的消息数量是均衡的,所以叫做 循环调度

这里要特别说明的是 basicConsume() 函数的第二个参数 autoAck,这个参数表示是否开启 消息自动确认,这是 RabbitMQ 的 消息确认(Message Acknowledgment) 特性。消息确认机制可以保证消息不会丢失,默认情况下,一旦 RabbitMQ 将消息发送给了消费者,就会从内存中删除,如果这时消费者挂掉,所有发给这个消费者的正在处理或尚未处理的消息都会丢失掉。如果我们让消费者在处理完成之后,发送一个消息确认(也就是 ACK),通知 RabbitMQ 这个消息已经接收并且处理完毕了,那么 RabbitMQ 才可以安全的删除该消息。很显然我们这里把 autoAck 参数设置为 true,是没有消息确认机制的,可能会出现消息丢失的情况。

循环调度有一个明显的缺陷,因为每个任务的处理时间是不一样的,所以按任务的先后顺序依次分配很可能会导致消费者消费的任务是不平衡的。我这里简单的模拟了这种不平衡的场景,首先生产者发送了 10 个任务,消费者处理奇数任务的执行时间设置为 5s,偶数任务执行时间设置为 1s,然后启动两个消费者实例,按循环调度算法,每个消费者都会领到 5 个任务,从任务数量上看是平衡的。但是从执行结果看,第一个消费者跑了 25s 才执行完所有任务,而第二个消费者 5s 就跑完了所有任务。对于这种情况,我们引入了公平调度方式。

如何实现公平调度呢?如果能让 RabbitMQ 不提前分配任务,而是在消费者处理完一个任务时才给它分配,不就可以了么?其实这里就要用到上面提到的消息确认机制了,RabbitMQ 提供了 basicQos() 函数用于设置消费者支持同时处理多少个任务,basicQos(1) 表示消费者最多只能同时处理一个任务,所以 RabbitMQ 每次都只分配一个任务给它,而且在这个任务没有处理完成之前,RabbitMQ 也不会给它推送新的任务。

公平调度的实现代码如下:(完整代码

        System.out.println(" [*] Waiting for messages. To exit press CTRL+C");
        channel.basicQos(1);
        channel.queueDeclare("hello-queue", false, false, false, null);
        channel.basicConsume("hello-queue", false, new DefaultConsumer(channel) {
            @Override
            public void handleDelivery(
                    String consumerTag,
                    Envelope envelope,
                    AMQP.BasicProperties properties,
                    byte[] body) throws IOException {
                try {
                    String message = new String(body, "UTF-8");
                    System.out.println("Message Recv: " + message);
                    int c = message.lastIndexOf(".") - message.indexOf(".");
                    if (c % 2 == 0) {
                        Thread.sleep(1000 * 5);
                    } else {
                        Thread.sleep(1000);
                    }
                } catch (Exception e) {
                    e.printStackTrace();
                } finally {
                    channel.basicAck(envelope.getDeliveryTag(), false);
                }
            }
        });

在这里 basicConsume() 函数的第二个参数设置成了 false,表示开启消息确认机制,而且在 handleDelivery() 函数中处理完消息后,通过 basicAck() 手工确认消息完成。确认的方法除了 basicAck,还有 basicNack 和 basicReject,它们的区别在于 basicNack 一次可以拒绝多条消息,而 basicReject 一次只能拒绝一条消息。

四、RabbitMQ 高级特性

通过上一节的学习,我们已经可以在我们的系统中使用 RabbitMQ 了,合理的采用消息队列,可以在程序中实现异步处理、应用解耦、流量削峰、消息通讯等等功能。除了这些消息队列的常规功能,RabbitMQ 还具有很多高级特性,这些特性大多是 RabbitMQ 对 AMQP 协议的扩展实现,更多的特性可以参考 官网文档:Protocol Extensions。这一节我们将学习延迟队列、优先级队列和持久化。

4.1 延迟队列

有时候我们不希望我们的消息立即被消费者消费,比如在网上购物时,如果用户下单完成后超过三十分钟未付款,订单需要自动取消,这个是延迟队列的一种典型应用场景,要实现这个功能,我们可以使用定时任务来实现,每隔一分钟扫描一次订单状态,但是这种做法显然效率太低了。当然,我们也可以用 DelayQueue、Timer、ScheduledExecutorService、Quartz 等带有调度功能的工具来实现,可以参考这篇博客中的相应实现:你真的了解延时队列吗。不过今天我们的重点是用 RabbitMQ 实现延迟队列。

延迟队列一般分为两种:基于消息的延迟和基于队列的延迟。基于消息的延迟是指为每条消息设置不同的延迟时间,那么每当队列中有新消息进入的时候就会重新根据延迟时间排序,显然这样做效率不是很高。实际应用中大多采用基于队列的延迟,每个队列中消息的延迟时间都是相同的,这样可以省去排序消息的工作,只需要检测超时时间按顺序投递即可。

事实上,RabbitMQ 并没有直接支持延迟队列,但是可以通过它的两个特性模拟出延迟队列来,这两个特性是:Time-To-Live ExtensionsDead Letter Exchanges

Time-To-Live Extensions 让我们可以在 RabbitMQ 里为消息或者队列设置过期时间(TTL,time to live),单位为毫秒,当一条消息被设置了 TTL 或者进入设置了 TTL 的队列时,这条消息会在经过 TTL 毫秒后成为 死信(Dead Letter)。我们可以像下面这样通过 x-message-ttl 参数定义一个延迟队列:

Map<String, Object> args = new HashMap<String, Object>();
args.put("x-message-ttl", 60 * 1000);
channel.queueDeclare(queueName, false, false, false, args);

上面这个延迟队列的 TTL 为 60 秒,也就是说,在这个队列中的消息,超过 60 秒就会变成死信。在 RabbitMQ 中,除了过期的消息,还有两种情况消息可能会变成死信,第一种情况是消息被拒绝,并且没有设置 requeue,第二种情况是消息队列如果已满,再往该队列投递消息也会变成死信。那么 RabbitMQ 是如何处理这些死信的呢?

在上面的例子中,我们为队列设置了一个 x-message-ttl 参数,我们还可以给队列添加另一个参数 x-dead-letter-exchange,这个就是 Dead Letter Exchange(DLX),这个参数决定了当某个队列中出现死信时会被转移到哪?DLX 是一个普通的交换机,和其他的交换机没有任何区别,死信被投递到 DLX 后,通过 DLX 再路由到其他队列,这取决于你给 DLX 绑定了哪些队列。另外,死信被投递到 DLX 时还可以通过参数 x-dead-letter-routing-key 指定 Routing Key。下面这个图很好的阐述了这个过程:(图片来源

rabbitmq-ttl-dlx.png

把 TTL 和 DLX 综合起来实现一个延迟队列如下:

// 创建 DLX
channel.exchangeDeclare("this-is-my-dlx", "direct");

// 设置队列的 TTL 和 DLX
Map<String, Object> args = new HashMap<String, Object>();
args.put("x-message-ttl", 60 * 1000);
args.put("x-dead-letter-exchange", "this-is-my-dlx");
args.put("x-dead-letter-routing-key", "");
channel.queueDeclare(queueName, false, false, false, args);

这里省略了消费者的代码,消费者可以创建一个队列,并绑定到 this-is-my-dlx 这个交换机上,当这个队列中有消息到达时,说明有消息超时了,譬如订单创建超过 30 分钟了,这时去判断订单是否已经付款,如果未付款,则取消订单。

如前文所述,不仅可以设置队列的超时时间,我们也可以设置消息的超时时间:

AMQP.BasicProperties.Builder properties = new AMQP.BasicProperties().builder().expiration("60000");
channel.basicPublish("exchangeName", "routeKey", properties.build(), "Hello".getBytes());

4.2 优先级队列

在 RabbitMQ 中我们可以使用 x-max-priority 参数将队列标记为优先级队列,优先级的值是一个整数,优先级的值越大,越被提前消费。x-max-priority 参数的值限制了优先级的最大值,一般不宜设置的太大。

Map<String, Object> args= new HashMap<String, Object>();
args.put("x-max-priority", 10);
channel.queueDeclare("priority-queue", false, false, false, args);

优先级队列在 RabbitMQ 管理页面的 Features 里可以看到 Pri 标志:

rabbitmq-priority-queue.jpg

我们按优先级 1 ~ 5 依次发送 5 条消息到这个队列:

for (int i = 1; i <= 5; i++) {
    AMQP.BasicProperties.Builder properties = new AMQP.BasicProperties().builder().priority(i);
    channel.basicPublish("", "priority-queue", properties.build(), ("Hello World" + i).getBytes());
}

然后启动消费者,可以看到 5 条消息并不是按顺序接受的,而是按优先级从大到小排序的:

 [*] Waiting for messages. To exit press CTRL+C
Message Recv: Hello World5
Message Recv: Hello World4
Message Recv: Hello World3
Message Recv: Hello World2
Message Recv: Hello World1

发送消息时,优先级不要超过 x-max-priority 的值,超过 x-max-priority 时按 x-max-priority 处理。另外有一点要注意:在这个例子里,我们不能先启动消费者,否则我们还是会看到消息是按顺序接受的,这是因为消息的优先级是在有消息堆积的时候才会有意义,如果消费者的消费速度比生产者的生产速度快,那么生产者刚发送完一条消息就被消费者消费了,队列中最多只有一条消息,还谈什么优先级呢。

4.3 持久化

在前面的例子里,我们学习了 RabbitMQ 的消息确认机制,这个机制可以保证消息不会由于消费者的崩溃而丢失。但是如果是 RabbitMQ 服务崩溃退出了呢?我们该如何保证交换机、队列以及队列中的消息在 RabbitMQ 服务崩溃之后不丢失呢?这就是持久化要解决的问题。在声明交换机和队列时,可以把 durable 设置为 true,在发送消息时,可以设置消息的 deliveryMode 属性为 2,如下:

持久化的交换机:

channel.exchangeDeclare("durable-exchange", BuiltinExchangeType.DIRECT, /*durable*/true);

持久化的队列:

channel.queueDeclare("durable-queue", /*durable*/true, false, false, null);

持久化的消息:

AMQP.BasicProperties.Builder properties = new AMQP.BasicProperties().builder().deliveryMode(2);
channel.basicPublish("", "durable-queue", properties.build(), "Hello World".getBytes());

为方便起见,也可以直接使用内置的 MessageProperties.PERSISTENT_TEXT_PLAIN 静态变量,可以看一下它的实现,实际上就是 deliveryMode = 2 的一个简单封装:

channel.basicPublish("", "durable-queue", MessageProperties.PERSISTENT_TEXT_PLAIN, "Hello World".getBytes());

关于持久化的话题,我们可以再深入研究一下。为了防止消费者丢消息,我们采取了消息确认机制;为了防止服务器丢消息,我们将交换机、队列和消息都设置成持久化的。但是这样就能万无一失了吗?答案是否定的。问题就在于持久化是需要将消息保存到磁盘的,如果在保存到磁盘的过程中 RabbitMQ 崩溃,消息一样会丢失。要解决这个问题,一个可选的方案是使用 RabbitMQ 的事务机制,不过事务机制会带来大量的开销,性能不高,所以又引入了 Publisher Confirm 机制。推荐王磊的这篇博客 《RabbitMQ事务和Confirm发送方消息确认——深入解读》

总结

通过这篇博客,我们学习了 AMQP 协议 和 RabbitMQ 的基本概念,并学习了 RabbitMQ 的安装和管理,通过官网的 6 个例子,掌握了交换机的几种常见类型:direct、fanout 和 topics,最后通过延迟队列、优先级队列和消息的持久化,我们还学习了 RabbitMQ 的一些高级特性。可以看出消息队列的功能非常丰富,我们常常在消息队列选型时,要综合考虑各种因素,功能是最重要的一条,InfoQ 上的这篇文章 《消息中间件选型分析:从Kafka与RabbitMQ的对比看全局》 介绍了更多要考虑的点。另外,限于篇幅,很多 RabbitMQ 的知识点没有展开,比如 RabbitMQ 的管理和监控,集群安装,事务和 Publisher Confirm 机制等。本文中所有代码使用的都是 amqp-client,如果你在用 Spring Boot,推荐使用 spring-boot-starter-amqp,这里 是官网的教程。

参考

  1. RabbitMQ Tutorials
  2. RabbitMQ中文 文档站
  3. Messaging with RabbitMQ
  4. 消息队列之JMS和AMQP对比
  5. RabbitMQ入门指南
  6. RabbitMQ与AMQP协议详解
  7. RabbitMQ从入门到精通
  8. 消息队列之 RabbitMQ
  9. 高可用RabbitMQ集群安装配置
  10. 基于 RabbitMQ 的实时消息推送
  11. 消息中间件选型分析:从Kafka与RabbitMQ的对比看全局
  12. 详细介绍Spring Boot + RabbitMQ实现延迟队列
  13. 你真的了解延时队列吗(一)
  14. RabbitMQ入门教程(十):队列声明queueDeclare
  15. Introducing Publisher Confirms

读 MySQL 源码再看 INSERT 加锁流程

在之前的博客中,我写了一系列的文章,比较系统的学习了 MySQL 的事务、隔离级别、加锁流程以及死锁,我自认为对常见 SQL 语句的加锁原理已经掌握的足够了,但看到热心网友在评论中提出的一个问题,我还是彻底被问蒙了。他的问题是这样的:

加了插入意向锁后,插入数据之前,此时执行了 select...lock in share mode 语句(没有取到待插入的值),然后插入了数据,下一次再执行 select...lock in share mode(不会跟插入意向锁冲突),发现多了一条数据,于是又产生了幻读。会出现这种情况吗?

这个问题初看上去很简单,在 RR 隔离级别下,假设要插入的记录不存在,如果先执行 select...lock in share mode 语句,很显然会在记录间隙之间加上 GAP 锁,而 insert 语句首先会对记录加插入意向锁,插入意向锁和 GAP 锁冲突,所以不存在幻读; 如果先执行 insert 语句后执行 select...lock in share mode 语句,由于 insert 语句在插入记录之后,会对记录加 X 锁,它会阻止 select...lock in share mode 对记录加 S 锁,所以也不存在幻读。两种情况如下所示:

先执行 INSERT 后执行 SELECT:

insert-before-select-locks.jpg

先执行 SELECT 后执行 INSERT:

insert-after-select-locks.jpg

但是我们仔细想一想就会发现哪里有点不对劲,我们知道 insert 语句会先在插入间隙上加上插入意向锁,然后开始写数据,写完数据之后再对记录加上 X 记录锁(这里简化了,关于 insert 语句的加锁流程,可以参考我之前写的 常见 SQL 语句的加锁分析)。那么问题就来了,如果在 insert 语句加插入意向锁之后,写数据之前,执行了 select...lock in share mode 语句,这个时候 GAP 锁和插入意向锁是不冲突的,查询出来的记录数为 0,然后 insert 语句写数据,加 X 记录锁,因为记录锁和 GAP 锁也是不冲突的,所以 insert 成功插入了一条数据,这个时候如果事务提交,select...lock in share mode 语句再次执行查询出来的记录数就是 1,岂不是就出现了幻读?

整个流程如下所示(我们把 insert 语句的执行分成两个阶段,INSERT 1 加插入意向锁,还没写数据,INSERT 2 写数据,加记录锁):

insert-12-select-locks.jpg

一、INSERT 加锁的困惑

在得出上面的结论时,我也感到很惊讶。按理是不可能出现这种情况的,只可能是我对这两个语句的加锁过程还没有想明白。于是我又去复习了一遍 MySQL 官方文档,Locks Set by Different SQL Statements in InnoDB 这篇文档对各个语句的加锁有详细的描述,其中对 insert 的加锁过程是这样说的(这应该是网络上介绍 MySQL 加锁机制被引用最多的文档,估计也是被误解最多的文档):

INSERT sets an exclusive lock on the inserted row. This lock is an index-record lock, not a next-key lock (that is, there is no gap lock) and does not prevent other sessions from inserting into the gap before the inserted row.

Prior to inserting the row, a type of gap lock called an insert intention gap lock is set. This lock signals the intent to insert in such a way that multiple transactions inserting into the same index gap need not wait for each other if they are not inserting at the same position within the gap. Suppose that there are index records with values of 4 and 7. Separate transactions that attempt to insert values of 5 and 6 each lock the gap between 4 and 7 with insert intention locks prior to obtaining the exclusive lock on the inserted row, but do not block each other because the rows are nonconflicting.

If a duplicate-key error occurs, a shared lock on the duplicate index record is set. This use of a shared lock can result in deadlock should there be multiple sessions trying to insert the same row if another session already has an exclusive lock. This can occur if another session deletes the row.

这里讲到了 insert 会对插入的这条记录加排他记录锁,在加记录锁之前还会加一种 GAP 锁,叫做插入意向锁,如果出现唯一键冲突,还会加一个共享记录锁。这和我之前的理解是完全一样的,那么究竟是怎么回事呢?难道 MySQL 的 RR 真的会出现幻读现象?

在 Google 上搜索了很久,并没有找到 MySQL 幻读的问题,百思不得其解之际,遂决定从 MySQL 的源码中一探究竟。

二、编译 MySQL 源码

编译 MySQL 的源码非常简单,但是中间也有几个坑,如果能绕过这几个坑,在本地调试 MySQL 是一件很容易的事(当然能调试源码是一回事,能看懂源码又是另一回事了)。

我的环境是 Windows 10 x64,系统上安装了 Visual Studio 2012,如果你的开发环境和我不一样,编译步骤可能也会不同。

在开始之前,首先要从官网下载 MySQL 源码(下载地址):

download-mysql-source.jpg

这里我选择的是 5.6.40 版本,操作系统下拉列表里选 Source Code,OS Version 选择 Windows(Architecture Independent),然后就可以下载打包好的 zip 源码了。

将源码解压缩到 D:\mysql-5.6.40 目录,在编译之前,还需要再安装几个必要软件:

  • CMake:CMake 本身并不是编译工具,它是通过编写一种平台无关的 CMakeList.txt 文件来定制编译流程的,然后再根据目标用户的平台进一步生成所需的本地化 Makefile 和工程文件,如 Unix 的 Makefile 或 Windows 的 Visual Studio 工程;
  • Bison:MySQL 在执行 SQL 语句时,必然要对 SQL 语句进行解析,一般来说语法解析器会包含两个模块:词法分析和语法规则。词法分析和语法规则模块有两个较成熟的开源工具 Flex 和 Bison 分别用来解决这两个问题。MySQL 出于性能和灵活考虑,选择了自己完成词法解析部分,语法规则部分使用了 Bison,所以这里我们还要先安装 Bison。Bison 的默认安装路径为 C:\Program Files\GnuWin32但是千万不要这样,一定要记得选择一个不带空格的目录,譬如 C:\GnuWin32 要不然在后面使用 Visual Studio 编译 MySQL 时会卡死;
  • Visual Studio:没什么好说的,Windows 环境下估计没有比它更好的开发工具了吧。

安装好 CMake 和 Bison 之后,记得要把它们都加到 PATH 环境变量中。做好准备工作,我们就可以开始编译了,首先用 CMake 生成 Visual Studio 的工程文件:

D:\mysql-5.6.40> mkdir project
D:\mysql-5.6.40> cd project
D:\mysql-5.6.40\project> cmake -G "Visual Studio 11 2012 Win64" ..

cmake 的 -G 参数用于指定生成哪种类型的工程文件,这里是 Visual Studio 2012,可以直接输入 cmake -G 查看支持的工程类型。如果没问题,会在 project 目录下生成一堆文件,其中 MySQL.sln 就是我们要用的工程文件,使用 Visual Studio 打开它。

打开 MySQL.sln 文件,会在 Solution Explorer 看到 130 个项目,其中有一个叫 ALL_BUILD,这个时候如果直接编译,编译会失败,在这之前,我们还要对代码做点修改:

  • 首先是 sql\sql_locale.cc 文件,看名字就知道这个文件用于国际化与本土化,这个文件里有各个国家的语言字符,但是这个文件却是 ANSI 编码,所以要将其改成 Unicode 编码;
  • 打开 sql\mysqld.cc 文件的第 5239 行,将 DBUG_ASSERT(0) 改成 DBUG_ASSERT(1),要不然调试时会触发断言;

现在我们可以编译整个工程了,选中 ALL_BUILD 项目,Build,然后静静的等待 5 到 10 分钟,如果出现了 Build: 130 succeeded, 0 failed 这样的提示,那么恭喜,你现在可以尽情的调试 MySQL 了。

我们将 mysqld 设置为 Startup Project,然后加个命令行参数 --console,这样可以在控制台里查看打印的调试信息:

debugging-mysqld.jpg

另外 client\Debug\mysql.exe 这个文件是对应的 MySQL 的客户端,可以直接双击运行,默认使用的用户为 ODBC@localhost,如果要以 root 用户登录,可以执行 mysql.exe -u root,不需要密码。

三、调试 INSERT 加锁流程

首先我们创建一个数据库 test,然后创建一个测试表 t,主键为 id,并插入测试数据:

> use test;
> create table t(id int NOT NULL AUTO_INCREMENT , PRIMARY KEY (id));
> insert into t(id) values(1),(10),(20),(50);

然后我们开两个客户端会话,一个会话执行 insert into t(id) value(30),另一个会话执行 select * from t where id = 30 lock in share mode。很显然,如果我们能在 insert 语句加插入意向锁之后写数据之前下个断点,再在另一个会话中执行 select 就可以模拟出这种场景了。

那么我们来找下 insert 语句是在哪加插入意向锁的。第一次看 MySQL 源码可能会有些不知所措,调着调着就会迷失在深深的调用层级中,我们看 insert 语句的调用堆栈,一开始时还比较容易理解,从 mysql_parse -> mysql_execute_command -> mysql_insert -> write_record -> handler::ha_write_row -> innobase::write_row -> row_insert_for_mysql,这里就进入 InnoDb 引擎了。

然后继续往下跟:row_ins_step -> row_ins -> row_ins_index_entry_step -> row_ins_index_entry -> row_ins_clust_index_entry -> row_ins_clust_index_entry_low -> btr_cur_optimistic_insert -> btr_cur_ins_lock_and_undo -> lock_rec_insert_check_and_lock

一路跟下来,都没有发现插入意向锁的踪迹,直到 lock_rec_insert_check_and_lock 这里:

if (lock_rec_other_has_conflicting(
        static_cast<enum lock_mode>(
            LOCK_X | LOCK_GAP | LOCK_INSERT_INTENTION),
        block, next_rec_heap_no, trx)) {

    /* Note that we may get DB_SUCCESS also here! */
    trx_mutex_enter(trx);

    err = lock_rec_enqueue_waiting(
        LOCK_X | LOCK_GAP | LOCK_INSERT_INTENTION,
        block, next_rec_heap_no, index, thr);

    trx_mutex_exit(trx);
} else {
    err = DB_SUCCESS;
}

这里是检查是否有和插入意向锁冲突的其他锁,如果有冲突,就将插入意向锁加到锁等待队列中。这很显然是先执行 select ... lock in share mode 语句再执行 insert 语句时的情景,插入意向锁和 GAP 冲突。但这不是我们要找的点,于是继续探索,但是可惜的是,直到 insert 执行结束,我都没有找到加插入意向锁的地方。

跟代码非常辛苦,我担心是因为我跟丢了某块的逻辑导致没看到加锁,于是我看了看加其他锁的地方,发现在 InnoDb 里行锁都是通过调 lock_rec_add_to_queue(没有锁冲突) 或者 lock_rec_enqueue_waiting(有锁冲突,需要等待其他事务释放锁) 来实现的,于是在这两个函数上下断点,执行一条 insert 语句,依然没有断下来,说明 insert 语句没有加任何锁!

到这里我突然想起之前做过的 insert 加锁的实验,执行 insert 之后,如果没有任何冲突,在 show engine innodb status 命令中是看不到任何锁的,这是因为 insert 加的是隐式锁。什么是隐式锁?隐式锁的意思就是没有锁!

所以,根本就不存在之前说的先加插入意向锁,再加排他记录锁的说法,在执行 insert 语句时,什么锁都不会加。这就有点意思了,如果 insert 什么锁都不加,那么如果其他事务执行 select ... lock in share mode,它是如何阻止其他事务加锁的呢?

答案就在于隐式锁的转换。

InnoDb 在插入记录时,是不加锁的。如果事务 A 插入记录且未提交,这时事务 B 尝试对这条记录加锁,事务 B 会先去判断记录上保存的事务 id 是否活跃,如果活跃的话,那么就帮助事务 A 去建立一个锁对象,然后自身进入等待事务 A 状态,这就是所谓的隐式锁转换为显式锁。

我们跟一下执行 select 时的流程,如果 select 需要加锁,则会走: sel_set_rec_lock -> lock_clust_rec_read_check_and_lock -> lock_rec_convert_impl_to_expllock_rec_convert_impl_to_expl 函数的核心代码如下:

impl_trx = trx_rw_is_active(trx_id, NULL);

if (impl_trx != NULL
    && !lock_rec_has_expl(LOCK_X | LOCK_REC_NOT_GAP, block,
              heap_no, impl_trx)) {
    ulint    type_mode = (LOCK_REC | LOCK_X
                 | LOCK_REC_NOT_GAP);

    lock_rec_add_to_queue(
        type_mode, block, heap_no, index,
        impl_trx, FALSE);
}

首先判断事务是否活跃,然后检查是否已存在排他记录锁,如果事务活跃且不存在锁,则为该事务加上排他记录锁。而本事务的锁是通过 lock_rec_convert_impl_to_expl 之后的 lock_rec_lock 函数来加的。

到这里,这个问题的脉络已经很清晰了:

  1. 执行 insert 语句,判断是否有和插入意向锁冲突的锁,如果有,加插入意向锁,进入锁等待;如果没有,直接写数据,不加任何锁;
  2. 执行 select ... lock in share mode 语句,判断记录上是否存在活跃的事务,如果存在,则为 insert 事务创建一个排他记录锁,并将自己加入到锁等待队列;

所以不存在网友所说的幻读问题。那么事情到此结束了么?并没有。

细心的你会发现,执行 insert 语句时,从判断是否有锁冲突,到写数据,这两个操作之间还是有时间差的,如果在这之间执行 select ... lock in share mode 语句,由于此时记录还不存在,所以也不存在活跃事务,不会触发隐式锁转换,这条语句会返回 0 条记录,并加上 GAP 锁;而 insert 语句继续写数据,不加任何锁,在 insert 事务提交之后,select ... lock in share mode 就能查到 1 条记录,这岂不是还有幻读问题吗?

为了彻底搞清楚这中间的细节,我们在 lock_rec_insert_check_and_lock 检查完锁冲突之后下个断点,然后在另一个事务中执行 select ... lock in share mode,如果它能成功返回 0 条记录,加上 GAP 锁,说明就存在幻读。不过事实上,这条 SQL 语句执行的时候卡住了,并不会返回 0 条记录。从 show engine innodb statusTRANSACTIONS 里我们看不到任何行锁冲突的信息,但是我们从 RW-LATCH INFO 中却可以看出一些端倪:

-------------
RW-LATCH INFO
-------------
RW-LOCK: 000002C97F62FC70
Locked: thread 10304 file D:\mysql-5.6.40\storage\innobase\btr\btr0cur.cc line 879  S-LOCK
RW-LOCK: 000002C976A3B998
Locked: thread 10304 file D:\mysql-5.6.40\storage\innobase\btr\btr0cur.cc line 256  S-LOCK
Locked: thread 10304 file d:\mysql-5.6.40\storage\innobase\include\btr0pcur.ic line 518  S-LOCK
Locked: thread 2820 file D:\mysql-5.6.40\storage\innobase\btr\btr0cur.cc line 256  S-LOCK
Locked: thread 2820 file D:\mysql-5.6.40\storage\innobase\row\row0ins.cc line 2339  S-LOCK
RW-LOCK: 000002C976A3B8A8  Waiters for the lock exist
Locked: thread 2820 file D:\mysql-5.6.40\storage\innobase\btr\btr0cur.cc line 256  X-LOCK
Total number of rw-locks 16434
OS WAIT ARRAY INFO: reservation count 10
--Thread 10304 has waited at btr0cur.cc line 256 for 26.00 seconds the semaphore:
S-lock on RW-latch at 000002C976A3B8A8 created in file buf0buf.cc line 1069
a writer (thread id 2820) has reserved it in mode  exclusive
number of readers 0, waiters flag 1, lock_word: 0
Last time read locked in file btr0cur.cc line 256
Last time write locked in file D:\mysql-5.6.40\storage\innobase\btr\btr0cur.cc line 256
OS WAIT ARRAY INFO: signal count 8
Mutex spin waits 44, rounds 336, OS waits 7
RW-shared spins 3, rounds 90, OS waits 3
RW-excl spins 0, rounds 0, OS waits 0
Spin rounds per wait: 7.64 mutex, 30.00 RW-shared, 0.00 RW-excl

这里列出了 3 个 RW-LOCK:000002C97F62FC70、000002C976A3B998、000002C976A3B8A8。其中可以看到最后一个 RW-LOCK 有其他线程在等待其释放(Waiters for the lock exist)。下面列出了所有等待该锁的线程,Thread 10304 has waited at btr0cur.cc line 256 for 26.00 seconds the semaphore,这里的 Thread 10304 就是我们正在执行 select 语句的线程,它卡在了 btr0cur.cc 的 256 行,我们查看 Thread 10304 的堆栈:

mysql-cond-wait.jpg

btr0cur.cc 的 256 行位于 btr_cur_latch_leaves 函数,如下所示,通过 btr_block_get 来加锁,看起来像是在访问 InnoDb B+ 树的叶子节点时卡住了:

case BTR_MODIFY_LEAF:
    mode = latch_mode == BTR_SEARCH_LEAF ? RW_S_LATCH : RW_X_LATCH;
    get_block = btr_block_get(
        space, zip_size, page_no, mode, cursor->index, mtr);

这里的 latch_mode == BTR_SEARCH_LEAF,所以加锁的 mode 为 RW_S_LATCH。

这里要介绍一个新的概念,叫做 Latch,一般也把它翻译成 “锁”,但它和我们之前接触的行锁表锁(Lock)是有区别的。这是一种轻量级的锁,锁定时间一般非常短,它是用来保证并发线程可以安全的操作临界资源,通常没有死锁检测机制。Latch 可以分为两种:MUTEX(互斥量)和 RW-LOCK(读写锁),很显然,这里我们看到的是 RW-LOCK。

我们回溯一下 select 语句的调用堆栈:ha_innobase::index_read -> row_search_for_mysql -> btr_pcur_open_at_index_side -> btr_cur_latch_leaves,从调用堆栈可以看出 select ... lock in share mode 语句在访问索引,那么为什么访问索引会被卡住呢?

接下来我们看看这个 RW-LOCK 是在哪里加上的?从日志里可以看到 Locked: thread 2820 file D:\mysql-5.6.40\storage\innobase\btr\btr0cur.cc line 256 X-LOCK,所以这个锁是线程 2820 加上的,加锁的位置也在 btr0cur.cc 的 256 行,查看函数引用,很快我们就查到这个锁是在执行 insert 时加上的,函数堆栈为:row_ins_clust_index_entry_low -> btr_cur_search_to_nth_level -> btr_cur_latch_leaves

我们看这里的 row_ins_clust_index_entry_low 函数(无关代码已省略):

UNIV_INTERN
dberr_t
row_ins_clust_index_entry_low(
/*==========================*/
    ulint        flags,    /*!< in: undo logging and locking flags */
    ulint        mode,    /*!< in: BTR_MODIFY_LEAF or BTR_MODIFY_TREE,
                depending on whether we wish optimistic or
                pessimistic descent down the index tree */
    dict_index_t*    index,    /*!< in: clustered index */
    ulint        n_uniq,    /*!< in: 0 or index->n_uniq */
    dtuple_t*    entry,    /*!< in/out: index entry to insert */
    ulint        n_ext,    /*!< in: number of externally stored columns */
    que_thr_t*    thr)    /*!< in: query thread */
{
    /* 开启一个 mini-transaction */
    mtr_start(&mtr);
    
    /* 调用 btr_cur_latch_leaves -> btr_block_get 加 RW_X_LATCH */
    btr_cur_search_to_nth_level(index, 0, entry, PAGE_CUR_LE, mode,
                    &cursor, 0, __FILE__, __LINE__, &mtr);
    
    if (mode != BTR_MODIFY_TREE) {
        /* 不需要修改 BTR_TREE,乐观插入 */
        err = btr_cur_optimistic_insert(
            flags, &cursor, &offsets, &offsets_heap,
            entry, &insert_rec, &big_rec,
            n_ext, thr, &mtr);
    } else {
        /* 需要修改 BTR_TREE,先乐观插入,乐观插入失败则进行悲观插入 */
        err = btr_cur_optimistic_insert(
            flags, &cursor,
            &offsets, &offsets_heap,
            entry, &insert_rec, &big_rec,
            n_ext, thr, &mtr);
        if (err == DB_FAIL) {
            err = btr_cur_pessimistic_insert(
                flags, &cursor,
                &offsets, &offsets_heap,
                entry, &insert_rec, &big_rec,
                n_ext, thr, &mtr);
        }
    }
    
    /* 提交 mini-transaction */
    mtr_commit(&mtr);
}

这里是执行 insert 语句的关键,可以发现执行插入操作的前后分别有一行代码:mtr_start()mtr_commit()。这被称为 迷你事务(mini-transaction),既然叫做事务,那这个函数的操作肯定是原子性的,事实上确实如此,insert 会在检查锁冲突和写数据之前,会对记录所在的页加一个 RW-X-LATCH 锁,执行完写数据之后再释放该锁(实际上写数据的操作就是写 redo log(重做日志),将脏页加入 flush list,这个后面有时间再深入分析了)。这个锁的释放非常快,但是这个锁足以保证在插入数据的过程中其他事务无法访问记录所在的页。mini-transaction 也可以包含子事务,实际上在 insert 的执行过程中就会加多个 mini-transaction,这中间的过程可以参考这篇博客:MySQL - InnoDB mini transation

每个 mini-transaction 会遵守下面的几个规则:

  • 修改一个页需要获得该页的 X-LATCH;
  • 访问一个页需要获得该页的 S-LATCH 或 X-LATCH;
  • 持有该页的 LATCH 直到修改或者访问该页的操作完成。

所以,最后的最后,真相只有一个:insertselect ... lock in share mode 不会发生幻读。整个流程如下:

  1. 执行 insert 语句,对要操作的页加 RW-X-LATCH,然后判断是否有和插入意向锁冲突的锁,如果有,加插入意向锁,进入锁等待;如果没有,直接写数据,不加任何锁,结束后释放 RW-X-LATCH;
  2. 执行 select ... lock in share mode 语句,对要操作的页加 RW-S-LATCH,如果页面上存在 RW-X-LATCH 会被阻塞,没有的话则判断记录上是否存在活跃的事务,如果存在,则为 insert 事务创建一个排他记录锁,并将自己加入到锁等待队列,最后也会释放 RW-S-LATCH;

参考

  1. Locks Set by Different SQL Statements in InnoDB
  2. Installing MySQL from Source
  3. CMake 入门实战
  4. MySQL源代码:从SQL语句到MySQL内部对象
  5. MySQL · 源码分析 · 一条insert语句的执行过程
  6. [MySQL源码] 一条简单insert语句的调用栈
  7. MySQL5.7 : 对隐式锁转换的优化
  8. [MySQL学习] Innodb锁系统(4) Insert/Delete 锁处理及死锁示例分析
  9. InnoDB事务锁之行锁-insert加锁-隐式锁加锁原理
  10. InnoDB事务锁之行锁-判断是否有隐式锁原理图
  11. InnoDB事务锁之行锁-隐式锁转换显示锁举例理解原理
  12. MySQL系列:innodb源码分析之mini transaction
  13. MySQL - InnoDB mini transation
  14. MySQL · 引擎特性 · InnoDB redo log漫游

最简单的一个 Spring Boot 项目

最近在项目中使用 Spring Boot,对它的简单易用印象很深刻。Spring Boot 最大的特点是它大大简化了传统 Spring 项目的配置,使用 Spring Boot 开发 Web 项目,几乎没有任何的 xml 配置。而且它最方便的地方在于它内嵌了 Servlet 容器(可以自己选择 Tomcat、Jetty 或者 Undertow),这样我们就不需要以 war 包来部署项目,直接使用 java -jar hello.jar 就可以运行一个 Web 项目。

我们以 Maven 项目为例,Spring Boot 除了支持 Maven,还支持 Gradle 项目。一个最简单的 Spring Boot Web 项目只有 3 个文件(其实如果想要更简单一点,入口和控制器类甚至可以写在同一个文件中)。首先是一个入口文件:

@SpringBootApplication
public class Application {
    public static void main(String[] args) {
        SpringApplication.run(Application.class, args);
    }
}

然后再写一个控制器类:

@RestController
public class HelloController {
    @RequestMapping("/")
    public String index() {
        return "Hello World!";
    }
}

最后是这个项目的 POM(Project Object Model,项目对象模型) 文件:

<?xml version="1.0" encoding="UTF-8"?>
<project xmlns="http://maven.apache.org/POM/4.0.0"
         xmlns:xsi="http://www.w3.org/2001/XMLSchema-instance"
         xsi:schemaLocation="http://maven.apache.org/POM/4.0.0 http://maven.apache.org/xsd/maven-4.0.0.xsd">
    <modelVersion>4.0.0</modelVersion>

    <groupId>com.stonie</groupId>
    <artifactId>spring-boot-sample</artifactId>
    <version>1.0-SNAPSHOT</version>

    <parent>
        <groupId>org.springframework.boot</groupId>
        <artifactId>spring-boot-starter-parent</artifactId>
        <version>2.0.2.RELEASE</version>
    </parent>

    <dependencies>
        <dependency>
            <groupId>org.springframework.boot</groupId>
            <artifactId>spring-boot-starter-web</artifactId>
        </dependency>
    </dependencies>

    <properties>
        <java.version>1.8</java.version>
    </properties>

    <build>
        <plugins>
            <plugin>
                <groupId>org.springframework.boot</groupId>
                <artifactId>spring-boot-maven-plugin</artifactId>
            </plugin>
        </plugins>
    </build>
</project>

在新建 Spring Boot 项目的时候要注意一点,入口类必须放在某个包下面,而不能放在默认包(也就是说不能直接放在 srcmainjava 目录下),否则会导致项目启动失败(其实原因很简单,因为 Spring Boot 通过 @ComponentScan 来扫描 Bean,如果入口类放在默认包下,也就意味着 Spring Boot 要扫描所有 jar 包中的所有的类):

** WARNING ** : Your ApplicationContext is unlikely to start due to a @ComponentScan of the default package.

至此,我们就写好了一个 Spring Boot 项目,完整的源码可以参考 这里。从代码上看项目非常简单,但是这里有很多值得我们学习的地方。

一、从 SpringBootApplication 注解看 Spring Boot 自动配置原理

Spring Boot 项目通常都有一个入口类,入口类中的 main 方法和标准的 Java 应用入口方法是一样的,在上面的例子中,这个 main 方法中只有一行代码:SpringApplication.run(),这是一个静态方法,用于启动整个 Spring Boot 项目。和其他 Java 程序不一样的是,入口类上多了一个 @SpringBootApplication 注解,这是非常重要的一个注解,它由多个注解组合而成,包括了:@SpringBootConfiguration@EnableAutoConfiguration@ComponentScan 和其他一些注解。Spring Boot 是如何做到不需要任何配置文件的,看名字也可以猜出来,其秘密就在于 @EnableAutoConfiguration 这个注解实现了自动配置。这个注解的实现如下:

@Target({ElementType.TYPE})
@Retention(RetentionPolicy.RUNTIME)
@Documented
@Inherited
@AutoConfigurationPackage
@Import({AutoConfigurationImportSelector.class})
public @interface EnableAutoConfiguration {
    String ENABLED_OVERRIDE_PROPERTY = "spring.boot.enableautoconfiguration";
    Class<?>[] exclude() default {};
    String[] excludeName() default {};
}

其中最为重要的一行代码为:@Import({AutoConfigurationImportSelector.class}),其中 @Import 是 Spring 提供的一个注解,可以导入配置类或者 Bean 到当前类中。AutoConfigurationImportSelector 类的实现比较复杂,简单来说就是扫描所有 jar 包中的 META-INF/spring-factories 文件,这个文件中声明了有哪些自动配置。我们可以打开 spring-boot-autoconfigure.jar 文件,这里就有这个文件,其中定义了一个属性 org.springframework.boot.autoconfigure.EnableAutoConfiguration 如下所示(有删减):

# Auto Configure
org.springframework.boot.autoconfigure.EnableAutoConfiguration=\
org.springframework.boot.autoconfigure.admin.SpringApplicationAdminJmxAutoConfiguration,\
org.springframework.boot.autoconfigure.aop.AopAutoConfiguration,\
org.springframework.boot.autoconfigure.amqp.RabbitAutoConfiguration,\
...
org.springframework.boot.autoconfigure.data.ldap.LdapRepositoriesAutoConfiguration,\
org.springframework.boot.autoconfigure.data.mongo.MongoDataAutoConfiguration,\
org.springframework.boot.autoconfigure.data.mongo.MongoReactiveDataAutoConfiguration,\
org.springframework.boot.autoconfigure.data.mongo.MongoReactiveRepositoriesAutoConfiguration,\
org.springframework.boot.autoconfigure.data.mongo.MongoRepositoriesAutoConfiguration,\
org.springframework.boot.autoconfigure.data.neo4j.Neo4jDataAutoConfiguration,\
org.springframework.boot.autoconfigure.data.neo4j.Neo4jRepositoriesAutoConfiguration,\
org.springframework.boot.autoconfigure.data.solr.SolrRepositoriesAutoConfiguration,\
org.springframework.boot.autoconfigure.data.redis.RedisAutoConfiguration,\
org.springframework.boot.autoconfigure.data.redis.RedisReactiveAutoConfiguration,\
org.springframework.boot.autoconfigure.data.redis.RedisRepositoriesAutoConfiguration,\
org.springframework.boot.autoconfigure.data.rest.RepositoryRestMvcAutoConfiguration,\
org.springframework.boot.autoconfigure.data.web.SpringDataWebAutoConfiguration,\
...
org.springframework.boot.autoconfigure.ldap.embedded.EmbeddedLdapAutoConfiguration,\
org.springframework.boot.autoconfigure.ldap.LdapAutoConfiguration,\
org.springframework.boot.autoconfigure.liquibase.LiquibaseAutoConfiguration,\
org.springframework.boot.autoconfigure.mail.MailSenderAutoConfiguration,\
org.springframework.boot.autoconfigure.mail.MailSenderValidatorAutoConfiguration,\
org.springframework.boot.autoconfigure.mongo.embedded.EmbeddedMongoAutoConfiguration,\
org.springframework.boot.autoconfigure.mongo.MongoAutoConfiguration,\
org.springframework.boot.autoconfigure.mongo.MongoReactiveAutoConfiguration,\
org.springframework.boot.autoconfigure.mustache.MustacheAutoConfiguration,\
org.springframework.boot.autoconfigure.orm.jpa.HibernateJpaAutoConfiguration,\
org.springframework.boot.autoconfigure.quartz.QuartzAutoConfiguration,\
...
org.springframework.boot.autoconfigure.web.client.RestTemplateAutoConfiguration,\
org.springframework.boot.autoconfigure.web.embedded.EmbeddedWebServerFactoryCustomizerAutoConfiguration,\
org.springframework.boot.autoconfigure.web.reactive.HttpHandlerAutoConfiguration,\
org.springframework.boot.autoconfigure.web.reactive.ReactiveWebServerFactoryAutoConfiguration,\
org.springframework.boot.autoconfigure.web.reactive.WebFluxAutoConfiguration,\
org.springframework.boot.autoconfigure.web.reactive.error.ErrorWebFluxAutoConfiguration,\
org.springframework.boot.autoconfigure.web.reactive.function.client.WebClientAutoConfiguration,\
org.springframework.boot.autoconfigure.web.servlet.DispatcherServletAutoConfiguration,\
org.springframework.boot.autoconfigure.web.servlet.ServletWebServerFactoryAutoConfiguration,\
org.springframework.boot.autoconfigure.web.servlet.error.ErrorMvcAutoConfiguration,\
org.springframework.boot.autoconfigure.web.servlet.HttpEncodingAutoConfiguration,\
org.springframework.boot.autoconfigure.web.servlet.MultipartAutoConfiguration,\
org.springframework.boot.autoconfigure.web.servlet.WebMvcAutoConfiguration,\
org.springframework.boot.autoconfigure.websocket.reactive.WebSocketReactiveAutoConfiguration,\
org.springframework.boot.autoconfigure.websocket.servlet.WebSocketServletAutoConfiguration,\
org.springframework.boot.autoconfigure.websocket.servlet.WebSocketMessagingAutoConfiguration,\
org.springframework.boot.autoconfigure.webservices.WebServicesAutoConfiguration

可以看到 Spring Boot 已经内置了大量的自动配置,我们查看我们这个项目的依赖关系,如下图:

spring-boot-dependency.png

我们这个项目中使用了 spring-boot-starter-web,可以看出它依赖于 spring-boot-starter-tomcat 和 spring-webmvc,所以这里会自动对 Tomcat 和 Spring MVC 进行配置。但是这里有一个问题,这里列出来的自动配置有那么多,难道 Spring Boot 都要一个个的去加载配置吗?当然不是,Spring Boot 也没那么傻,所以这里就要重点介绍一下从 Spring 4.x 开始引入的一个新特性:@Conditional(也叫 条件注解)。

@Conditional 可以根据条件来创建 Bean,譬如随便拿上面一个自动配置类 RedisAutoConfiguration 来看,其中用到的条件注解为 @ConditionalOnClass({RedisOperations.class}) 说明只有在 RedisOperations 类存在时才会自动配置,而我们这个项目并没有引入 redis,所以并不会加载 redis 的配置。

@Configuration
@ConditionalOnClass({RedisOperations.class})
@EnableConfigurationProperties({RedisProperties.class})
@Import({LettuceConnectionConfiguration.class, JedisConnectionConfiguration.class})
public class RedisAutoConfiguration {
}

那么我们的程序在启动的时候都自动加载了哪些配置呢?我们可以通过命令行参数 --debug 来启动 Spring Boot 应用:

$ java -jar hello.jar --debug

启动时控制台会打印出详情的信息,类似于下面这样(实际打印的日志会非常多,有兴趣的同学可以自行挖掘):

============================
CONDITIONS EVALUATION REPORT
============================

Positive matches:
-----------------

   EmbeddedWebServerFactoryCustomizerAutoConfiguration.TomcatWebServerFactoryCustomizerConfiguration matched:
      - @ConditionalOnClass found required classes 'org.apache.catalina.startup.Tomcat', 'org.apache.coyote.UpgradeProtocol'; @ConditionalOnMissingClass did not find unwanted class (OnClassCondition)

   ServletWebServerFactoryAutoConfiguration matched:
      - @ConditionalOnClass found required class 'javax.servlet.ServletRequest'; @ConditionalOnMissingClass did not find unwanted class (OnClassCondition)
      - found ConfigurableWebEnvironment (OnWebApplicationCondition)

   ServletWebServerFactoryAutoConfiguration#tomcatServletWebServerFactoryCustomizer matched:
      - @ConditionalOnClass found required class 'org.apache.catalina.startup.Tomcat'; @ConditionalOnMissingClass did not find unwanted class (OnClassCondition)

   ServletWebServerFactoryConfiguration.EmbeddedTomcat matched:
      - @ConditionalOnClass found required classes 'javax.servlet.Servlet', 'org.apache.catalina.startup.Tomcat', 'org.apache.coyote.UpgradeProtocol'; @ConditionalOnMissingClass did not find unwanted class (OnClassCondition)
      - @ConditionalOnMissingBean (types: org.springframework.boot.web.servlet.server.ServletWebServerFactory; SearchStrategy: current) did not find any beans (OnBeanCondition)

   WebMvcAutoConfiguration matched:
      - @ConditionalOnClass found required classes 'javax.servlet.Servlet', 'org.springframework.web.servlet.DispatcherServlet', 'org.springframework.web.servlet.config.annotation.WebMvcConfigurer'; @ConditionalOnMissingClass did not find unwanted class (OnClassCondition)
      - found ConfigurableWebEnvironment (OnWebApplicationCondition)
      - @ConditionalOnMissingBean (types: org.springframework.web.servlet.config.annotation.WebMvcConfigurationSupport; SearchStrategy: all) did not find any beans (OnBeanCondition)

Negative matches:
-----------------

   ActiveMQAutoConfiguration:
      Did not match:
         - @ConditionalOnClass did not find required classes 'javax.jms.ConnectionFactory', 'org.apache.activemq.ActiveMQConnectionFactory' (OnClassCondition)

我从日志中挑选中我们这里比较感兴趣的 EmbeddedWebServerFactoryCustomizerAutoConfiguration,我们看看它的实现:

embedded-webserver-auto-config.png

从这里就可以看出 Spring Boot 支持三种嵌入的 Web Server:Undertow、Jetty 和 Tomcat。根据上面的依赖关系 spring-boot-starter-web 默认是加载 spring-boot-starter-tomcat 的,所以这里会自动加载 Tomcat 的配置。

如果我们想改变默认的 Web Server,譬如改成轻量级的 Undertow,可以在 POM 文件中使用 exclusion 移除对 spring-boot-starter-tomcat 的引用,并加上对 spring-boot-starter-undertow 的引用,如下:

<dependencies>
    <dependency>
        <groupId>org.springframework.boot</groupId>
        <artifactId>spring-boot-starter-web</artifactId>
        <exclusions>
            <exclusion>
                <groupId>org.springframework.boot</groupId>
                <artifactId>spring-boot-starter-tomcat</artifactId>
            </exclusion>
        </exclusions>
    </dependency>
    <dependency>
        <groupId>org.springframework.boot</groupId>
        <artifactId>spring-boot-starter-undertow</artifactId>
    </dependency>
</dependencies>

二、探究 Spring MVC 如何映射请求?

第二个文件是控制器类,粗看上去就是一个普通的类,外加上一个方法,只不过加上了两个注解 @RestController@RequestMapping("/") 这个方法竟然就可以处理 Web 请求了。是不是觉得这有点神奇?为什么在浏览器里访问 http://localhost:8080 时页面会显示出这里返回的 Hello World!

其实,这一切都是 Spring MVC 的功劳。只不过在 Spring Boot 项目里,Spring MVC 的配置被简化了。我们先回忆一下在传统的 Spring MVC 里如何实现一个控制器类,首先,我们要先在 web.xml 里定义 DispatcherServlet,并为这个 Servlet 配置相应的 servlet-mapping,类似于下面这样:

<web-app>
    <display-name>appName</display-name>

    <context-param>
        <param-name>contextConfigLocation</param-name>
        <param-value>
            classpath:/applicationContext.xml
        </param-value>
    </context-param>

    <listener>
        <listener-class>
            org.springframework.web.context.ContextLoaderListener
        </listener-class>
    </listener>

    <servlet>
        <servlet-name>dispatcher</servlet-name>
        <servlet-class>
            org.springframework.web.servlet.DispatcherServlet
        </servlet-class>
        <load-on-startup>1</load-on-startup>
    </servlet>

    <servlet-mapping>
        <servlet-name>dispatcher</servlet-name>
        <url-pattern>/*</url-pattern>
    </servlet-mapping>
</web-app>

可以说 DispatcherServlet 是 Spring MVC 的核心,通过上面这个配置,它就可以截获 Web 应用的所有请求并将其分派给相应的处理器进行处理。在 Servlet 3.0 之后,还可以通过编程的方式来配置 Servlet 容器,Spring MVC 提供了一个接口 WebApplicationInitializer,通过实现这个接口也可以达到 web.xml 配置文件的目的,如下所示:

public class AppInitializer implements WebApplicationInitializer {
   @Override
   public void onStartup(ServletContext container) {
     XmlWebApplicationContext appContext = new XmlWebApplicationContext();
     appContext.setConfigLocation("/WEB-INF/spring/dispatcher-config.xml");
     ServletRegistration.Dynamic dispatcher =
       container.addServlet("dispatcher", new DispatcherServlet(appContext));
     dispatcher.setLoadOnStartup(1);
     dispatcher.addMapping("/");
   }
}

那么 DispatcherServlet 是如何把 HTTP 请求映射到控制器的某个方法的呢?感兴趣的可以看看 DispatcherServlet 的源码,其实在 DispatcherServlet 初始化的时候,会扫描当前容器所有的 Bean,将包含 @Controller@RequestMapping 注解的类和方法,映射到 HandleMappering,为了实现这一点,Spring MVC 一般都有一个 dispatch-servlet.xml 配置文件:

<beans>
    <context:component-scan base-package="com.stonie.hello" />
    <bean class="org.springframework.web.servlet.mvc.method.annotation.RequestMappingHandlerMapping" />
    <bean class="org.springframework.web.servlet.mvc.method.annotation.RequestMappingHandlerAdapter" />
</beans> 

其中,component-scan 用于开启注解扫描,RequestMappingHandlerMapping 叫做 处理器映射RequestMappingHandlerAdapter 叫做 处理器适配器(在老版本的 Spring MVC 中你可能看到的是 DefaultAnnotationHandlerMappingAnnotationMethodHandlerAdapter)。这两个类负责将 HTTP 方法,HTTP 路径,HTTP 参数匹配到具体的 @RequestMapping 注解的类和方法上。

@RequestMapping 注解的方法所支持的参数类型和返回类型非常丰富和灵活,从这里也可以看出 Spring MVC 的强大之处。这样虽然让开发人员可以根据需要任意选择,但是也会给开发人员带来困惑,可以参考这篇博客的总结:Spring MVC @RequestMapping 方法所支持的参数类型和返回类型详解

上面就是 Spring MVC 实现请求映射的原理,在传统的 Spring MVC 项目中,这样的配置文件是很常见的,但是在 Spring Boot 项目中,这些配置都自动实现了,可以再深入研究下 DispatcherServletAutoConfigurationWebMvcAutoConfiguration 这两个类。

三、解读 POM 文件

POM 的 全称叫做 Project Object Model,翻译过来就是项目对象模型,它用来定义项目的基本信息,构建步骤,依赖信息等等。pom.xml 文件作为 Maven 项目的核心,和 Make 的 Makefile、Ant 的 build.xml 文件一样。

在这篇博客的最后,让我们来看看这个项目的 pom.xml 文件。首先我们定义了三个元素:groupIdartifactIdversion,这被称为 Maven 坐标,Maven 坐标保证了每个项目都有一个唯一的坐标值,当我们需要在其他项目中引用这个项目时,通过坐标就可以很方便的定位到该项目。

然后下面定义了一个依赖 spring-boot-starter-web,并声明这个 POM 继承自 spring-boot-starter-parent,别小看这一句继承,里面可是另有乾坤。你可以打开 spring-boot-starter-parent 的 POM 文件,可以发现它又继承自 spring-boot-dependencies。在 spring-boot-starter-parent 中定义了一堆的插件,这些插件让 Maven 也能构建 Spring Boot 项目,其中最重要的一个插件是 spring-boot-maven-plugin,这就是我们项目后面要用到的插件。另外,在 spring-boot-dependencies 中定义了一堆的依赖,足足有 3000+ 行,我们前面介绍 Spring Boot 的自动配置原理时就说过,它定义了很多自动配置类,几乎能用到的依赖它都依赖了。

在 pom.xml 文件的 <build> 元素中定义了 spring-boot-maven-plugin 插件之后,就可以运行下面的命令和平常的 jar 包一样进行打包了:

$ mvn clean package

而如果在这里没有定义 <build> 元素,也可以通过下面的命令来打包:

$ mvn clean package spring-boot:repackage

如果不用这个命令,打出来的包里只有我们写的两个类文件,所有依赖的 jar 包都没有包含进去,这样的 jar 包是无法运行的。而 spring-boot:repackage 插件会在执行完 mvn package 之后再次进行打包为可执行的软件包,并且将 mvn package 打的原始的包命名为 *.jar.original。

我们可以打开 *.jar.original 里的 META-INFMANIFEST.MF 文件:

Manifest-Version: 1.0
Implementation-Title: spring-boot-sample
Implementation-Version: 1.0-SNAPSHOT
Built-By: aneasystone
Implementation-Vendor-Id: com.stonie
Created-By: Apache Maven 3.3.9
Build-Jdk: 1.8.0_111
Implementation-URL: https://projects.spring.io/spring-boot/#/spring-bo
 ot-starter-parent/spring-boot-sample

然后再打开 *.jar 里的 META-INFMANIFEST.MF 文件:

Manifest-Version: 1.0
Implementation-Title: spring-boot-sample
Implementation-Version: 1.0-SNAPSHOT
Built-By: aneasystone
Implementation-Vendor-Id: com.stonie
Spring-Boot-Version: 2.0.2.RELEASE
Main-Class: org.springframework.boot.loader.JarLauncher
Start-Class: com.stonie.Application
Spring-Boot-Classes: BOOT-INF/classes/
Spring-Boot-Lib: BOOT-INF/lib/
Created-By: Apache Maven 3.3.9
Build-Jdk: 1.8.0_111
Implementation-URL: https://projects.spring.io/spring-boot/#/spring-bo
 ot-starter-parent/spring-boot-sample

可以发现新打的包里多了五行代码:

Spring-Boot-Version: 2.0.2.RELEASE
Main-Class: org.springframework.boot.loader.JarLauncher
Start-Class: com.stonie.Application
Spring-Boot-Classes: BOOT-INF/classes/
Spring-Boot-Lib: BOOT-INF/lib/

并且我们可以在 BOOT-INF/lib/ 目录下找到项目依赖的所有 jar 包,说明 spring-boot-maven-plugin 插件已经自动帮我们把 jar 包转换成了一个可运行的 Spring Boot 应用。

要理解 Spring Boot 是如何通过 Maven 打包的,这里有两个非常重要的概念:生命周期插件目标。Maven 定义了三套生命周期:clean、default 和 site,其中 clean 用于清理项目,default 用于执行构建项目需要的具体步骤,site 用于发布项目站点。其中 clean 和 default 是最常使用的。譬如我们平常执行 mvn clean compile 来清理并编译项目时就用到了 clean 和 default 生命周期,其中,mvn clean 调用的是 clean 生命周期的 clean 阶段,mvn compile 调用的是 default 生命周期的 compile 阶段。

通过 mvn 命令不仅可以直接调用生命周期的某个阶段,还可以调用某个插件目标,譬如上面的 mvn spring-boot:repackage 就是调用 spring-boot 插件的 repackage 目标。实际上,Maven 的核心就是插件,它是一款基于插件的框架,所有的工作其实都是交给插件完成的,包括上面说的 clean 和 compile 实际上就是通过 clean:cleancompiler:compile 这两个插件完成的。

不过上面的命令中还有一个问题,执行 mvn spring-boot:repackage 时,Maven 为什么可以根据 spring-boot 这个名字定位到 spring-boot-maven-plugin 这个插件的?这是因为 spring-boot 就是 spring-boot-maven-plugin 插件,这被称为 插件前缀,为了方便书写 mvn 命令,可以给每个插件都定义一个插件前缀,这样就不用在命令行中写那么长的插件名称了。

总结

越是看似简单的东西,背后越是蕴含着无限玄机,从平时的开发工作中,要善于从细节中发现问题。虽然这个 Spring Boot 项目只有三个非常简单的文件,但是想彻底弄懂每个文件,绝对不是那么容易。

参考

  1. Building an Application with Spring Boot
  2. Spring application does not start outside of a package
  3. Spring Boot 的自动配置
  4. Spring Boot 学习笔记 02 -- 深入了解自动配置
  5. Difference between spring @Controller and @RestController annotation
  6. Spring6:基于注解的 Spring MVC(上篇)
  7. Spring MVC @RequestMapping 方法所支持的参数类型和返回类型详解
  8. Spring Boot 的 Maven 插件 Spring Boot Maven plugin 详解
  9. Spring Boot Maven Plugin

使用 Python + Selenium 破解滑块验证码

在前面一篇博客《使用 Python + Selenium 打造浏览器爬虫》中,我介绍了 Selenium 的基本用法和爬虫开发过程中经常使用的一些小技巧,利用这些写出一个浏览器爬虫已经完全没有问题了。看了前一篇博客,可能有人会有疑惑,浏览器爬虫的优势感觉并不比传统爬虫多多少啊,特别是通过遍历页面元素来获取爬虫数据的方式和传统爬虫解析 HTML 文档结构的方式如出一辙。为了体现浏览器爬虫的优越性,我特意准备了这篇博客,来看看如果要破解滑块验证码,浏览器爬虫比传统爬虫要容易多少。

一、滑块验证码简述

有爬虫,自然就有反爬虫,就像病毒和杀毒软件一样,有攻就有防,两者彼此推进发展。反爬技术历经多年,从最简单的检测 UserAgent 或者 Referrer 等头部,到限制访问频率封 IP 等手段,到关键路径的行为识别,到前端页面的混淆和加密,到目前最流行的验证码技术,可以说,为了防止网络上大量爬虫的肆意妄为,特别是一些垃圾机器人,技术人员真的是绞尽脑汁。但是道高一尺魔高一丈,直到目前为止,也并没有完全无懈可击的反爬方案。

目前最流行的反爬技术是验证码,几乎所有网站的注册页面都会用到验证码技术,为了防止爬虫自动注册,批量生成垃圾账号。验证码技术从一诞生,就是黑客们最感兴趣的话题,验证码的英文为 CAPTCHA(Completely Automated Public Turing test to tell Computers and Humans Apart),翻译成中文就是 全自动区分计算机和人类的公开图灵测试,它是一种可以区分用户是计算机还是人的测试,只要能通过 CAPTCHA 测试,该用户就可以被认为是人类。使用计算机模拟人类的行为一直以来都是黑客们最热衷的事情,也是黑客们梦寐以求的理想。所以验证码技术从一提出,就有大量的人尝试破解,其实这些人并不是为了制造垃圾爬虫,他们只是相信计算机可以和人一样,阿西莫夫的机器人世界在未来是可能的。

最初的验证码只是一张图片,图片上显示扭曲变形的文字和数字,这样的验证码通过图像处理和识别的技术可以达到很高的识别率。后来验证码技术又在图片上加入了各种干扰项,并且将字符粘连在一起,增加了字符切割和识别的难度,但是很快人们就想出了很多种不同的去噪方法,并使用骨架算法切割粘连字符,还有些人提出使用机器学习算法来切割字符。和图片验证码类似的是语音验证码,不过这种验证码只是在表现形式上有所区别,实质上和图片并没有太大的变化,采用语音识别技术破解也不是难事。而且语音和图片比起来缺乏交互,花样要少很多,识别难度也要低一些,所以只有在给盲人或者对颜色分辨有障碍的人提供服务时才可能会使用语音验证码,一般情况下使用的比较少。在静态的图片验证码被破解之后,又出现了动态的图片验证码,将字符动态的显示在 gif 动画上,不过这也没什么用,通过图像识别技术一样可以破解,实在破解不了的,还可以通过网上一些廉价的打码平台来人肉识别。

打码平台的诞生可以说是验证码领域的一件大事,它虽然不是什么高科技,只是把全世界廉价的劳动力汇集在了一起,就这样,再复杂的验证码都不在话下。这虽然不是什么光荣的事,但是它推动了验证码技术的发展,交互式验证码被开发出来。传统的图片验证码采用一问一答的形式,只要答案正确,就认为验证通过,它并不关心答案是怎么来的,所以出现了一些人工打码平台,你提供一个问题,它们提供一个答案,仅此而已。如果不仅仅关注答案的正确性,还将提交答案的过程记录下来,通过分析提交答案的过程,完全可以识别出这是不是一个人在操作,这就是交互式验证码的基本思路。这种验证码很难通过打码平台来破解,因为你必须对着浏览器,使用鼠标对验证码进行一系列的交互操作。

最耳熟能详的交互验证码莫过于 12306 的了,这种验证码叫做 图中点选 式验证码,同时提供多个图像,让用户根据条件点击选择。也有些验证码是同时显示 N 个变形的汉字让你选,原理与 12306 的类似,但这种验证码以其极差的用户体验遭到很多人的唾弃,这也是大多数产品不愿意选用的一个原因。滑块验证码 比图中点选体验好很多,它只需要用户使用鼠标将滑块从某个位置拖动到另一个位置即可。程序通过记录用户拖动滑块的轨迹,这一串的轨迹数据采用模式识别的手段就可以判断出这是否是真人在操作。最简单的滑块验证码是用户拖动滑块从左拖到右即可,后来又出现了 拼图式 的滑块,滑块作为图的一部分,然后背景图中有一个缺口刚好和滑块相同形状,需要用户将滑块拖到缺口中拼成一张完整的图片。现在比较流行的滑块验证码有 极验网易云易盾,本篇博客以极验的滑块验证码为例,其他的滑块验证码原理是类似的。

最新的交互式验证码甚至只需要用户点击一个按钮即可验证,不需要做任何其他的操作,譬如 极验的第三代行为验证技术易盾的智能无感知验证码。这种验证码的破解方式和滑块验证码不一样,我目前也没有太多的了解,后面有时间再研究研究吧。

最后不得不说的是,还有一种交互式验证码为短信或电话验证码,通过将验证码以短信的形式发送到你的手机,或者使用语音机器人自动打电话播报验证码,更有甚者,需要用户自己编辑短信将验证码发送到某个号码。对于这种验证码我认为并不能算作是 CAPTCHA,因为它利用的是用户的有限资源(手机号)这个客观限制,而并非是从技术角度来区分人和机器人的区别。如果某个人拥有大量的手机号(其实,黑产中确实也有专门养卡卖卡的),这种验证手段就形同虚设了。

二、破解思路

目前,极验正在推广其第三代行为验证技术,滑块验证码貌似已经没有前两年那么流行了,不过仍然有很多网站还在使用滑块验证码。譬如我这篇博客就以 春秋航空的会员注册页面 为例。

chunqiu-register.png

好了,上面讲了那么多,下面就开始我们的破解之旅吧。

2.1 传统爬虫

如果采用传统爬虫的方式来破解,首先我们需要测试下正常验证的情况是什么样的。在 Chrome 浏览器中按 F12 打开开发者工具,然后拖动滑块到正确位置,可以观察到 Network 面板发送的 Ajax 请求。

chunqiu-register-network.png

可以看到这个请求的参数非常复杂,每个参数的含义也完全没有头绪,如果要破解这个验证码,则必须模拟发送这个请求,这个请求的每个参数都必须弄清楚,于是我们在代码中搜索发送这个请求的地方。但事实上到这里我们就遇到了困难,ajax.php 这个请求根本就搜不到,甚至在浏览器中下 XHR 断点也不行(很显然它并不是一个 Ajax 请求),这是因为极验的核心代码经过了代码混淆。

geetest.js.png

这样的代码也就只有机器能读懂,大多数人肯定是直接放弃了。不过网上也有大量的分析文章,如果你感兴趣可以自己研究下,譬如 Windows应用开发 的知乎专栏上就有几篇介绍 极验验证码破解的系列文章,还有 FanhuaandLuomu这篇破解文章 也写得很好,推荐。

我在这里跳过对混淆代码的分析,总结下破解这样的滑块验证码的思路:

  1. 捕获所有关键请求;
  2. 分析调试混淆的代码,弄懂每个请求每个参数的含义,其中肯定会有一个参数,是拖动滑块的轨迹;
  3. 验证码图片是打乱的,需要解析页面上的样式,并使用图像处理方法还原出原始图像;
  4. 根据原始的图像和滑块位置得到缺口的偏移量;
  5. 滑块轨迹的模拟;
  6. 如果参数有加密处理,还需要模拟它的加密过程;实在不行可以直接在代码里模拟执行页面上的 JS;
  7. ...

可见这里的工作量非常大,破解难度可想而知,而且混淆的代码随时可能会发布新的版本,一旦版本升级,参数都有可能发生变化,之前的所有分析工作都可能前功尽弃。

除非实在是迫不得已,我并不推荐传统的这种破解方法。首先这样的破解方法太脆弱,不够通用,随时可能失效;其次这样的破解工作费时费力,就算破解出来也得不到成就感和满足感,对程序员的打击太大,他可能再也不会玩第二次了(除非他是极客中的极客,就以破解混淆代码为乐)。所以,还是让我们来看看浏览器爬虫如何。

2.2 浏览器爬虫

由于浏览器爬虫完全是以人为第一视角,你所看到的,就是浏览器爬虫看到的,甚至,它能比你看到更多。我们可以大概的总结下浏览器爬虫的破解思路:

  1. 图像识别,找到滑块的位置和缺口的位置;
  2. 模拟鼠标拖动,将滑块拖到缺口位置;

没错,就两步。虽然其中会遇到一些坑,但真的就这两步。使用上一篇博客中介绍的 Selenium 技巧,可以很快的写下下面的代码:

chrome_options = webdriver.ChromeOptions()
chrome_options.add_argument("--start-maximized")
browser = webdriver.Chrome(
    executable_path="./drivers/chromedriver.exe",
    chrome_options=chrome_options
)
browser.get('https://account.ch.com/NonRegistrations-Regist')
Wait(browser, 60).until(
    Expect.visibility_of_element_located((By.CSS_SELECTOR, "div[data-target='account-login']"))
)
email = browser.find_element_by_css_selector("div[data-target='account-login']")
email.click()

Wait(browser, 60).until(
    Expect.visibility_of_element_located((By.ID, "emailRegist"))
)
register = browser.find_element_by_id("emailRegist")
register.click()

offset = get_gap_offset(browser)
drag_and_drop(browser, offset)

关键就在于最后两个方法 get_gap_offset()drag_and_drop(),下面就来看下这两个方法的实现。

三、验证码图片处理

审查验证码图片元素,可以看到下面这样的 HTML 代码:

<div class="gt_cut_fullbg_slice" style="background-image: url('https://static.geetest.com/pictures/gt/3999642ae/3999642ae.webp'); background-position: -157px -58px;"></div>

这样的代码一共有 52 行,每一个 div 都是 10px * 58px 的小块。我们打开这个 background-image 对应的图片可以看出这是一张乱序的图片,这里的 background-position 用于显示出正确的图片。在代码上面,可以发现和这里完全类似的代码,background-position 都完全一样,只是 background-image 不一样,我们打开对应的图片,也是乱序的,但和上一张图片对比,可以猜测出,这是带有缺口的背景图片。

<div class="gt_cut_bg_slice" style="background-image: url('https://static.geetest.com/pictures/gt/3999642ae/bg/fbdb18152.webp'); background-position: -157px -58px;"></div>

一个很自然的想法就是把这两张乱序的图片根据 background-position 重组成两张看得懂的图片,然后对比两张图片,得到缺口的偏移量,然后将缺口偏移量减去滑块偏移量,就可以得到要拖动的偏移量。如下图所示:

geetest-image-process.png

其中滑块的偏移量可以通过下面的代码得到(其中,left: 12px 就是滑块的偏移量):

<div class="gt_slice gt_show" style="left: 12px; background-image: url('https://static.geetest.com/pictures/gt/e6e7e0440/slice/fa2d5bbd8.png'); width: 55px; height: 55px; top: 20px;"></div>

这里需要用到一点点图像处理的知识,我们采用大名鼎鼎的 Pillow,Pillow 是 Python 里的图像处理库(PIL:Python Image Library),在开始之前,可以先看下它的官网教程,这里有一份中文文档也可以参考。计算缺口偏移量的关键代码如下:

def get_slider_offset(image_url, image_url_bg, css):
    image_file = io.BytesIO(requests.get(image_url).content)
    im = Image.open(image_file)
    image_file_bg = io.BytesIO(requests.get(image_url_bg).content)
    im_bg = Image.open(image_file_bg)

    # 10*58 26/row => background image size = 260*116
    captcha = Image.new('RGB', (260, 116))
    captcha_bg = Image.new('RGB', (260, 116))
    for i, px in enumerate(css):
        offset = convert_css_to_offset(px)
        region = im.crop(offset)
        region_bg = im_bg.crop(offset)
        offset = convert_index_to_offset(i)
        captcha.paste(region, offset)
        captcha_bg.paste(region_bg, offset)
    diff = ImageChops.difference(captcha, captcha_bg)
    return get_slider_offset_from_diff_image(diff)

代码很好理解,就是根据 css 将两张背景图片重新排序生成两张新图片,然后通过 ImageChops.difference() 方法得到两张图片的差值图像,最后通过差值图像得到缺口的偏移量。其中有一点要注意的是,Pillow 的 Image.open() 方法只支持文件,不支持 URL,所以将图片转换为 BytesIO 对象,BytesIO 和 StringIO 一样,是 Python 提供的在内存中操作 bytes 和 str 的类,并且和读写文件具有一致的接口。

这种计算缺口位置的方法需要解析页面源码以及图片的 CSS 样式,其实还有一种更简单的方法:在显示验证码图片时对浏览器进行截图,这个时候的图像是完整的背景图像;然后再点击滑块,这个时候滑块和缺口都会显示出来,再对浏览器进行截图;分析两次的截图也可以计算出拖动的偏移量。有兴趣的同学可以一试。

四、模拟滑块拖动

在得到拖动偏移量后,我们就可以通过 Selenium 提供的方法来拖动滑块了:

def drag_and_drop(browser, offset):
    knob = browser.find_element_by_class_name("gt_slider_knob")
    ActionChains(browser).drag_and_drop_by_offset(knob, offset, 0).perform()

Selenium 将一系列连续的动作封装在 ActionChains 类 中,其中 drag_and_drop() 方法可以将一个元素拖到另一个元素上,drag_and_drop_by_offset() 方法可以指定拖动的偏移,正是我们这里所需要的。

到这里,我们已经看到希望了,胜利就在前方。不过,还不能高兴得太早,上面的方法虽然成功将滑块拖到缺口位置了,但是并没有验证通过,页面提示拼图被怪物吃掉了。。。

geetest-retry.png

很显然,这种方法很容易被检测出来是机器所为,因为人不可能拖那么快。于是我稍微调整了下程序,改成每次拖 10px,然后等待 1s 再拖 10px,依次循环,不过可惜的是,这种拖法拼图依然被怪物吃掉了,想想也是,人怎么可能拖的这么有规律呢?

于是继续调整我的程序,在中间加入了随机数的成分,改成每次拖 1~20px(随机),然后等待 0~2s(随机),本想着这种方式应该能成功了,但是事与愿违,还是被怪物吃掉,不过,在测试的时候,10 次里面竟然也成功了一次。

看来极验对拖动轨迹的验证还是很厉害的,它是如何识别出是机器拖动的还是人拖动的呢?人在拖动的时候,又有什么样的规律呢?为了搞清楚这一点,我在网上找了一款用于记录鼠标位置的小工具 MouseController,运行之后按 F9 就可以开始或停止记录,并可以将鼠标轨迹保存到一个 mcd 文件中。使用这个工具我将手工拖动滑块的轨迹记录下来,并写了一个脚本(脚本代码参见这里)画出手工拖动滑块的轨迹图,如下:

hand_tracks.png

看到这个轨迹图,我们应该能想出手工拖动的规律了:先快速向右拖动,快到缺口位置时,再减速慢调。接下来的问题就是如何通过算法来生成这样的轨迹了。

模拟滑块拖动的算法网上也有很多,有的直接根据手工拖动的轨迹按比例生成程序要拖动的轨迹,有的根据物理学中的加速度减速度来模拟轨迹,还有根据正切函数图像来模拟轨迹的,可说各有千秋。不过它们的成功率都不能达到很满意,我在这里介绍一种与众不同的方法,而且成功率可以高达 99%。

我看到上面这个轨迹图的时候,第一反应不是上述任何一种算法,而是 jquery.easing,可能是由于最近刚用 jquery.easing 实现了几个动画效果吧。我们知道,jQuery 可以实现很多不同的动画效果,譬如淡入淡出移动等等,为了让动画有好的过渡变化过程,官方提供了一个 easing 属性,但是官方没有给出很多过渡效果。于是就有了 jquery.easing 这个插件,这个插件增加了很多种过渡效果,引入之后可以让动画过渡过程更加多样化。Easing 有时又叫做 缓动函数,用于指定动画效果在执行时的速度,使其看起来更加真实。这里有一份缓动函数速查表,你可以在这里找到常见的缓动函数(还可以体验各种缓动函数的效果):

easing-functions.png

和上面的轨迹图做个对比就可以发现,轨迹图明显和 easeOut 类 的缓动函数很类似,如:easeOutQuadeaseOutQuarteaseOutExpo 等等。那么我们能不能写个 Python 版的 easing 函数呢?说干就干,我们参考 jquery.easing 的源码 实现了三种 easeOut 函数如下:

import numpy as np
import math

def ease_out_quad(x):
    return 1 - (1 - x) * (1 - x)

def ease_out_quart(x):
    return 1 - pow(1 - x, 4)

def ease_out_expo(x):
    if x == 1:
        return 1
    else:
        return 1 - pow(2, -10 * x)

def get_tracks(distance, seconds, ease_func):
    tracks = [0]
    offsets = [0]
    for t in np.arange(0.0, seconds, 0.1):
        ease = globals()[ease_func]
        offset = round(ease(t/seconds) * distance)
        tracks.append(offset - offsets[-1])
        offsets.append(offset)
    return offsets, tracks

其中 get_tracks() 方法可以根据滑块的偏移,需要的时间(相对时间,并不是准确时间),以及要采用的缓动函数生成拖动轨迹。然后就可以通过下面的方法,实现出想要的拖动效果了:

def drag_and_drop(browser, offset):
    knob = browser.find_element_by_class_name("gt_slider_knob")
    offsets, tracks = easing.get_tracks(offset, 12, 'ease_out_expo')
    ActionChains(browser).click_and_hold(knob).perform()
    for x in tracks:
        ActionChains(browser).move_by_offset(x, 0).perform()
    ActionChains(browser).pause(0.5).release().perform()

如果你感兴趣,还可以模拟出更多的效果,我们甚至可以实现出 easeOutBounce 这种类似小球落地时的弹跳效果。而且更有意思的是,用这种方法来拖动滑块,竟然也可以通过验证。(极验的验证算法还真是让人摸不清啊)

def ease_out_bounce(x):
    n1 = 7.5625
    d1 = 2.75
    if x < 1 / d1 :
        return n1 * x * x
    elif x < 2 / d1:
        x -= 1.5 / d1
        return n1 * x*x + 0.75
    elif x < 2.5 / d1:
        x -= 2.25 / d1
        return n1 * x*x + 0.9375
    else:
        x -= 2.625 / d1
        return n1 * x*x + 0.984375

总结

通过本文可以看出,破解滑块验证码,浏览器爬虫要比传统爬虫简单的多。不仅仅是破解滑块验证码,在遇到传统爬虫很难解决的问题时,浏览器爬虫都可以提供一种更方便的解决方案。但是俗话说得好,针无双头利,蔗无两头甜,凡事有利必有弊,并没有万能的解决方案,还是需要根据需求来取舍,譬如你的生产环境没有浏览器,那么你不得不使用传统爬虫。但是在正常情况下,我还是推荐最简单的那个选择。

本文的完整源码在 这里

参考

  1. 滑块验证码(滑动验证码)相比图形验证码,破解难度如何?
  2. 以GeeTest为例的滑动验证码破解
  3. 极验滑动验证码的识别
  4. 爬虫笔记(10)插曲 挑战极限验证码
  5. Pillow 中文文档
  6. 关于动画,你需要知道的
  7. 缓动函数速查表
  8. jQuery Easing 使用方法及其图解